Pro Tips: how to use multiple charts in tradingview Effectively
Author: Jameson Richman Expert
Published On: 2025-10-22
Prepared by Jameson Richman and our team of experts with over a decade of experience in cryptocurrency and digital asset analysis. Learn more about us.
Summary: This comprehensive guide explains how to use multiple charts in TradingView to improve market context, perform multi-timeframe analysis, compare assets, and manage positions across multiple monitors. You'll learn step-by-step setup for multi-chart layouts, syncing symbols and indicators, best practices for different trading styles (scalping, swing, portfolio monitoring), account limitations, and actionable workflows. Throughout the article you'll also find respected external resources and examples to put the techniques into practice.

Why use multiple charts in TradingView?
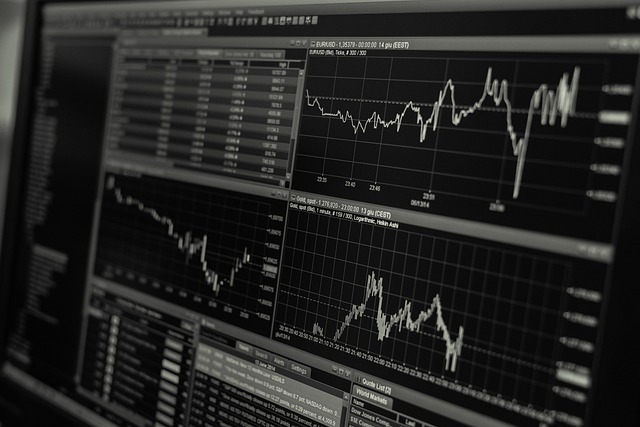
Multiple charts let traders view several instruments or different timeframes of the same instrument simultaneously. Instead of toggling back and forth between timeframes or symbols, multi-chart layouts provide side-by-side context: higher-timeframe trend, intra-day execution, and a comparison panel for correlated assets. This approach speeds decision-making, reduces missed signals, and supports strategies like paired trading or portfolio rebalancing.
Key benefits:
- Faster context: View trend, momentum, and entry-levels at once.
- Reduced errors: Avoid flipping between tabs and missing cues.
- Correlation checks: Compare related assets (e.g., BTC vs ETH) instantly.
- Better risk management: Monitor multiple positions across symbols.
Related concepts and resources
If you’re new to technical analysis, read the overview on Technical analysis (Wikipedia). For official guidance on TradingView features and limits, consult the TradingView Help Center. These sources provide foundational knowledge that complements the practical steps below.
What you can do with multiple charts in TradingView
- Multi-timeframe analysis: 1H / 4H / Daily / Weekly of the same symbol.
- Cross-symbol comparison: BTC vs ETH, crypto vs stocks, or related forex pairs.
- Strategy testing: Monitor live trades while viewing strategy performance charts.
- Portfolio watch: Keep an eye on multiple holdings and spot divergences.
- Execution & analytics split: One chart for execution (smaller timeframe) and others for confirmation (higher timeframes).

TradingView account levels and multi-chart limits
TradingView restricts the number of charts in a single layout depending on your subscription tier. Free accounts have very limited multi-chart capability, while Pro, Pro+, and Premium unlock more split layouts and higher limits for indicators per chart. Check TradingView’s pricing page for the latest limits, or see the Help Center for detailed feature comparisons.
Practical rule:
If you rely on multiple charts for live trading (scalping or fast day trading), consider at least a Pro account to reduce friction and get faster symbol loading.
Step-by-step: Setting up multiple charts in TradingView
Follow these steps (web or desktop) to configure multi-chart layouts that fit your workflow.
- Open a chart: Sign in at TradingView and open a single chart for your initial symbol.
- Choose a layout: Click the "Select layout" icon (usually looks like a grid) at the top toolbar. Select the desired split — 2, 3, 4, 6, or custom grid depending on your plan.
- Assign symbols to panels: Click each panel and enter the symbol or ticker you want to load (e.g., BTCUSDTPERP, ETHUSD). Use the search bar to find exchanges and tickers quickly.
- Sync options: In the layout controls, enable the "Link" icon and pick a color group if you want panels to follow the same symbol when you change one. Use the "Sync" menu (or gear icon) to choose what to sync: Symbol, Interval (timeframe), Crosshair, and/or Drawings.
- Set timeframes: Choose different timeframes per panel for multi-timeframe analysis (e.g., 1H, 4H, Daily). If you sync intervals, changing one will change all synced panels.
- Load indicators and templates: Add indicators to one panel and save them as a template if you want to reuse the same indicator set across panels. Use the "Indicator templates" feature to apply consistent studies.
- Save the layout: Save your setup with a descriptive name (e.g., "Scalper 3-panel") for quick access later.
Tips for visually clean multi-charts
- Limit visible indicators per panel to avoid clutter and performance lag.
- Use contrasting colors for different panels to reduce eye strain.
- Turn off backgrounds and excessive labels if you monitor many panels on one screen.
How to sync drawings, indicators, and symbols
Syncing is the most powerful feature for multi-chart workflows:
- Link symbol: When enabled, selecting a symbol in one chart loads the same symbol in linked charts.
- Link interval: Sync timeframes so switching the timeframe on one chart applies to all linked charts.
- Crosshair & tool sync: Enable crosshair sync so that the pointer aligns across charts, making it easy to compare price points across timeframes.
- Drawings and annotations: You can sync or keep drawings separate. For multi-timeframe analysis on the same symbol, syncing drawings helps visualize support/resistance across frames.

Practical workflows and examples
1) Multi-timeframe confirmation (swing trading)
Strategy: Use 1D for trend, 4H for structure, and 1H for entries.
- Left panel: Daily chart with moving averages and macro trend annotations.
- Middle panel: 4H chart with pivot levels, RSI, and support/resistance.
- Right panel: 1H chart for precise entries and stop placement.
Set the symbol to sync, but keep timeframes unsynced so you can scroll each independently. Use crosshair sync to align dates across panels for clarity.
2) Correlation check (crypto portfolio)
Strategy: Monitor BTC, ETH, and a top alt coin side-by-side to identify leading/lagging behavior.
- Panel 1: BTCUSDT — primary market driver.
- Panel 2: ETHUSDT — second-largest market influence.
- Panel 3: An alt (e.g., LINK or a memecoin) to spot divergence.
Quick example and further reading: For deep dives into individual crypto trends, check market forecasts and analyses like this piece on Bitcoin share price now in 2025 — a deep dive or the Pepe Coin price prediction 2025 for altcoin-specific context.
3) Pair trading and spread monitoring
Strategy: Compare two correlated coins and monitor the spread to find mean-reversion entries.
- Panel A: Chart of asset A.
- Panel B: Chart of asset B.
- Panel C: A ratio chart (A/B) or a custom Pine Script that plots spread and z-score.
Advanced: Using Pine Script with multiple charts
Pine Script runs per chart but can request data from other symbols using the security() function. This enables chart-level indicators that reference other assets or timeframes, which is useful when your layout cannot show a ratio natively.
Example: Simple spread indicator between BTC and ETH (conceptual, short):
//@version=5
indicator("BTC/ETH Spread", overlay=false)
btc = request.security("BINANCE:BTCUSDT", "1D", close)
eth = request.security("BINANCE:ETHUSDT", "1D", close)
spread = btc / eth
plot(spread, color=color.orange)
Place this indicator on a dedicated panel to monitor the spread without loading both symbols into separate charts. For full Pine Script documentation, visit the TradingView Pine Script docs.
Optimizing performance and layout for live trading
When monitoring many charts live, performance matters. Follow these best practices:
- Prefer the desktop app over browser when possible — it's typically faster and more stable.
- Limit the number of indicators per chart; heavy scripts slow down updates.
- Use fewer panels or spread panels across multiple monitors for clearer visibility.
- Disable auto-reload on charts you don't need updating every second.

Mobile vs Desktop: What to use when
TradingView mobile app supports multi-chart layouts but with limitations on screen size and the number of visible panels. Desktop or web with multiple monitors is recommended for active trading. Use the mobile app for quick checks, alerts, and trade confirmations when you’re away from your desk.
Saving templates and automating layout recall
Save your chart templates (indicators and styles) and layout configurations so you can switch strategies quickly. Use names that describe the workflow — e.g., “Daytrade 3x”, “Swing MTF”, “Portfolio Monitor”. You can also duplicate layouts and tweak one panel without affecting the original saved version.
Common mistakes and how to avoid them
- Overcrowding: Too many indicators or panels can paralyze decision-making. Keep focused metrics only.
- Over-syncing: Syncing every setting may make it hard to compare different timeframes. Choose which elements to sync carefully.
- Ignoring refresh delays: Some data feeds update slower than others; know the sources behind your tickers.
- Not saving layouts: Always save after significant edits to avoid losing your setup.

Examples: Templates for specific traders
Scalper template (3 panels)
- Left: 1-minute chart with order flow and VWAP.
- Middle: 5-minute with EMA ribbon and RSI.
- Right: 15-minute with key daily pivots.
Swing template (3 panels)
- Left: Weekly trend with major moving averages.
- Middle: Daily chart with MACD and volume profile.
- Right: 4H for entries and risk management.
Portfolio monitor (4 panels)
- BTC chart — macro driver.
- ETH chart — alt market driver.
- Top alt of interest.
- Performance/ratio chart (BTC dominance or custom indicator).
For further trading ideas, signal approaches, and live examples you can learn from, see this guide on crypto live trading tips and broader market perspective articles like this ETH Zurich review (contextual reading). These can provide situational awareness and narrative drivers that complement technical layouts.
Using multiple monitors with TradingView
Multi-monitor setups are ideal for traders using many charts. Typical configuration:
- Center monitor: Primary execution chart.
- Left: Higher-timeframe context and news feed.
- Right: Correlated symbols and orderbook/alerts.
Keep brokers and exchange dashboards on separate screens for quick order execution. If you trade spot or derivatives, consider creating exchange accounts with reputable platforms: Binance, MEXC, Bitget, and Bybit — all provide APIs and often integrate with TradingView alerts for execution workflows.
Alerts and automation across multiple charts
Alerts save time — especially when watching several charts. TradingView alerts can be configured per panel and include custom messages, webhook URLs, and conditions from indicators or price levels. Use webhooks to connect alerts to execution tools, bots, or third-party trade automation platforms. Remember to test alerts in a demo environment first if you automate live orders.

Checklist before trading live with multi-chart layouts
- Saved layout name and backup.
- Indicator templates loaded and verified for performance.
- Alerts set and tested (where applicable).
- Data feed/exchange tickers confirmed for latency and accuracy.
- Execution platform connected (broker/exchange) and tested.
Further reading and high-authority references
Deepen your knowledge with official and academic resources:
- TradingView Help Center — official documentation and guides.
- Technical analysis — Wikipedia — foundational concepts and common indicators.
- Multi-timeframe analysis (Investopedia) — practical definitions and examples.
FAQ: Quick answers
Q: How many charts can I view at once?
A: It depends on your TradingView subscription. Free accounts are limited; paid tiers (Pro, Pro+, Premium) allow more panels and features. Check TradingView’s pricing for current limits.
Q: Can I sync indicators across charts?
A: You can save indicator templates and apply them to multiple charts. The link/sync options allow sharing of symbols, intervals, crosshairs, and drawings. Some elements must be applied per chart if you want variations.
Q: Is Pine Script shared between panels?
A: Pine executes per chart but it can reference other symbols and timeframes via request.security(). That lets you plot multi-symbol indicators on a single chart or create ratio analyses.
Q: Should I use TradingView or native exchange charts for execution?
A: TradingView is excellent for analysis and alerts. For execution, use the exchange’s orderbook or API integrations. Many traders run TradingView for signals and a connected exchange (Binance, MEXC, Bitget, Bybit) for execution. Explore exchange features and fees before trading live.

Final recommendations
Mastering how to use multiple charts in TradingView is a major productivity boost for traders. Start simple: pick a two- or three-panel layout that fits your style (scalp, swing, or portfolio monitoring). Save templates, practice alert configurations, and scale up as you become comfortable. Combine technical setups with macro insights and quality market research to form higher-probability trades — for instance, read topical analyses and forecasts to inform your positioning, such as the Pepe Coin price prediction or the market outlooks like Bitcoin 2025 deep-dive.
If you trade actively, consider pairing TradingView with reliable exchanges — open accounts on reputable platforms such as Binance, MEXC, Bitget, or Bybit — and integrate with alerts and APIs as needed.
For ongoing education and live-trade techniques, this resource on crypto live trading tips provides hands-on insights. Use experimentation — keep a demo or small-size account while developing multi-chart routines — and document your layouts and rules for consistent results.