How to Show Two Charts in TradingView — 2025 Guide
Author: Jameson Richman Expert
Published On: 2025-10-29
Prepared by Jameson Richman and our team of experts with over a decade of experience in cryptocurrency and digital asset analysis. Learn more about us.
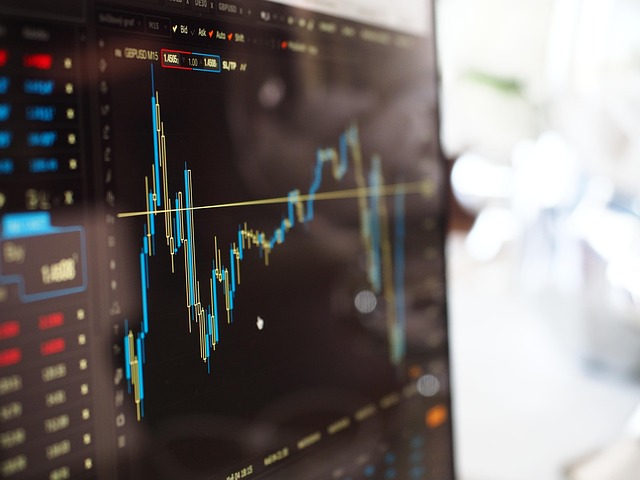
Learning how to show two charts in TradingView is essential for traders who want to compare markets, timeframes, and indicators side‑by‑side. This 2025 guide walks you through step‑by‑step setup, syncing options, practical examples (for example, viewing BTC/USDT and ETH/USDT together), troubleshooting tips, and advanced workflows to get the most from TradingView’s multi‑chart feature. You’ll also find recommended settings, keyboard shortcuts, and links to deeper resources and market tools for live trading.

Why view two charts at once?
Showing two charts simultaneously saves time and improves analysis quality. Common uses include:
- Comparing two cryptocurrencies (BTC vs ETH) or a crypto and its perpetual contract.
- Watching the same symbol on different timeframes (1H + 4H) for trend confirmation.
- Comparing spot vs derivatives price action across exchanges.
- Testing indicator behavior across different timeframes without switching tabs.
Before starting, note that TradingView’s multi‑chart layout availability depends on plan level (Free, Pro, Pro+, Premium). Check the most current plan details at the official TradingView pricing page for 2025 to confirm limits and features (multi‑chart layouts, number of charts per layout): TradingView Pricing & Plans.
Quick overview: Two ways to show two charts in TradingView
There are two main approaches:
- Split layout (two independent chart panes) — Ideal if you want each pane to display different symbols or timeframes and optionally sync them.
- Compare / Overlay — Adds a second symbol as an overlay inside one chart (useful for ratio analysis and correlation).
Step‑by‑step: How to show two charts in TradingView (split layout)
Follow these practical steps to set up two independent charts side‑by‑side:
1. Open a TradingView chart
Log in to TradingView at tradingview.com and open the Chart view. If you don’t have an account yet, create one first (free plan allows single chart layout; upgrades enable multi‑chart layouts).
2. Select the layout icon
Locate the Select Layout icon in the top toolbar (usually looks like a grid or squares). Click it to open layout options. Choose the two‑panel layout (side‑by‑side or stacked) to split the workspace into two charts.
3. Assign symbols to each pane
Each chart pane has its own symbol field at the top left. Click into that field and type the symbol you want (e.g., BTCUSDT, ETHUSDT). Press Enter to load the symbol in that pane.
4. Link charts when needed
If you want both charts to dynamically change together, use the chart linking feature:
- On each pane, click the small colored box or linking dropdown near the symbol name.
- Select the same link color/number for both panes — this links symbols.
- Use the layout or settings menu to enable additional synchronization options such as timeframe sync, crosshair sync, and drawing sync (these let you scroll or change timeframe on one chart and update the other).
Tip: If you want only the crosshair synced but not the symbol, enable Crosshair Sync only.
5. Apply indicators and templates
Set up your indicators on one pane and either save them as an indicator template or apply the same template to the second pane. Creating indicator templates saves time and ensures consistent settings across charts.
6. Save your layout
Click the cloud or layout menu and save the current layout so you can quickly recall the two‑chart view later. Name it descriptively (e.g., "BTC–ETH Side‑by‑Side").

Step‑by‑step: How to show two charts in TradingView (overlay/compare)
If you prefer one chart with two symbols overlaid (common for correlation and spread analysis), use the Compare feature:
- Open a chart with your primary symbol (e.g., BTCUSDT).
- Click the Compare or Add symbol button in the toolbar.
- Search for the second symbol (e.g., ETHUSDT) and choose the overlay option.
- The second symbol will appear on the same price axis; use the indicator panel to switch it to percentage scale if desired.
Note: Overlay mode is great for correlation visualizations but less suited for direct price comparisons when absolute price scales differ significantly.
Practical examples and workflows
Example 1: Two timeframes for trend confirmation
Open a 4H chart on the left and a 1H chart on the right. Link the charts by symbol only (not timeframe), then apply identical indicators (e.g., EMA 50, EMA 200, RSI). Use the 4H to define overall trend and the 1H to refine entry/exit points.
Example 2: Spot vs Perpetual contract
Load BTC/USDT (spot) on the left and BTCUSD perpetual (Derivatives) on the right to see basis and funding rate impacts. This is especially useful ahead of major macro events or rollovers. Consider saving this layout for quick monitoring.
Example 3: Cross‑exchange comparison (price divergence)
Display BTC on Binance on one pane and BTC on another exchange on the second. You can detect arbitrage opportunities and exchange‑specific order book behavior. For exchange accounts try Binance, MEXC, Bitget, and Bybit — here are registration links if you trade live:
Using these accounts alongside TradingView’s charts can help you confirm live order book depth and execution spreads. For market context and trade signals you might also consult expert reviews and forecasts such as this in‑depth trading signals review and predictive analysis for BTC: Best crypto trading signal provider — data‑driven review and the weekly price outlook for Bitcoin here: Bitcoin price forecast — key drivers.
Sync options explained (what to link and when)
When using two charts you can selectively sync the following:
- Symbol sync — both panes change symbol in tandem. Use when comparing timeframes of the same instrument.
- Timeframe sync — change timeframe on one pane and the other updates. Use for multi‑timeframe coupling.
- Crosshair sync — crosshair position and coordinates mirror across panes, which helps correlate price/volume on the same timestamp.
- Drawing/Object sync — trendlines, fib retracements, annotations replicate across linked charts. Useful for consistent analysis but be careful when symbols differ in scale.
Best practice: link the symbol when you want identical instruments and timeframes; only enable drawing sync if both charts are the same symbol or you need identical annotations across different timeframes.

Advanced tips and productivity hacks
Use templates to speed setup
Create and save chart layout templates including scales, indicators, and colors so you can apply them to new panes instantly. Templates ensure reproducibility and faster decision making.
Keyboard shortcuts
Learn TradingView hotkeys for toggling timeframes (e.g., 1, 5, 15, 60), switching tools (trendline, fib), and toggling full screen to navigate two charts faster. View the full list on TradingView’s help pages.
Pop out charts to multiple monitors
If you use multiple monitors, open a second TradingView window (or pop out a chart) and load a saved two‑chart layout there. This creates a flexible workspace for large setups. Note: multi‑window capabilities differ by browser and subscription level.
Combine with watchlists and alerts
Keep a shared watchlist visible while monitoring two charts so you can jump symbols quickly. Create alerts that reference price levels on either chart; TradingView alerts work across your layouts if you configure them centrally.
Troubleshooting: Common issues and fixes
If you can’t show two charts or features act unexpectedly, try these fixes:
- Plan limits: Verify your TradingView subscription—multi‑chart layouts may be limited on free plans. Check TradingView Pricing.
- Browser issues: Clear cache, disable ad blockers or privacy extensions, and ensure your browser is up to date.
- Sync confusion: If charts won’t sync, double‑check each pane’s link color/number and the global sync toggles.
- Indicator overload: Too many indicators can slow charts. Remove unused indicators or consult a guide on disabling them quickly: How to turn off indicators in TradingView — guide.
How to use two charts for live trading — practical checklist
Before executing trades, use this quick checklist to ensure your two‑chart setup supports live decision making:
- Symbols loaded correctly on each pane (spot/perp or different symbols).
- Desired sync options enabled (or disabled) depending on workflow.
- Indicator templates applied and visible; key levels marked (support/resistance).
- Alerts set for critical price levels using TradingView alerts or exchange orders.
- Order execution plan prepared on your exchange (use limit vs market as per strategy).
To trade live after analysis, link your charts to exchange order books and consider registering at trusted exchanges — use these registration links for immediate access:

Examples using Bitcoin — integrate forecasts and live price guides
To practice with real market scenarios, set up one pane for BTC/USDT (spot) and the other for BTCUSD perpetual, add an overlay of ETH/USDT on one pane, and run the following checks:
- Compare price action with the latest Bitcoin forecasts to set expectation ranges. A helpful weekly forecast is available here: Bitcoin price forecast — key drivers.
- For a live setup and USDT pair specifics, this practical guide on viewing Bitcoin price live on TradingView and USDT pairing is useful: Bitcoin price live USDT — TradingView 2025 guide.
Common multi‑chart setups for specific trader types
- Scalpers: 1‑minute + 5‑minute charts with price depth overlay; minimal indicators to keep latency low.
- Swing traders: 4H + Daily charts with EMA ribbon and volume profile; drawing sync useful for fib retracements.
- Arbitrage traders: Two same‑symbol charts across different exchanges with order book snapshots open.
- Options/Derivatives traders: Underlying price + implied volatility chart side‑by‑side for real‑time hedging decisions.
Security and data accuracy considerations
When using two charts for live trading, ensure your data sources are reliable. Confirm exchange tickers and data providers in TradingView match the exchange’s REST/WebSocket feed you use for orders. For background on how technical charting complements financial analysis, see the Wikipedia overview of technical analysis.
Extra resources and reading
Official TradingView documentation and support pages are the most authoritative resources for UI changes, hotkeys, and plan details. In addition, reputable educational pages such as Investopedia provide good primers on reading charts and indicators (see Investopedia — Technical Analysis).
Final checklist: Ready to show two charts in TradingView?
Use this final checklist to confirm your two‑chart workflow is optimized:
- Choose the correct layout (side‑by‑side or stacked).
- Assign symbols for each pane and confirm scales are appropriate.
- Decide which elements to sync (symbol, timeframe, crosshair, drawings).
- Save indicator templates and layout for fast recall.
- Test pop‑out/multi‑window if you use multiple monitors.
- Set alerts and link your analysis to an exchange account using trusted registration links.
Further reading and expert content
If you want deeper, data‑driven signal analysis or guides on optimizing TradingView for crypto markets, consult the expert resources below:
- Comprehensive review — best crypto trading signal providers
- Bitcoin price forecast and macro drivers
- Practical guide: how to turn off indicators in TradingView
- Bitcoin price live on TradingView — USDT pairing guide (2025)

Closing thoughts
Mastering how to show two charts in TradingView enhances your ability to compare instruments, validate trades across timeframes, and quickly react to market changes. Whether you’re comparing BTC and ETH, watching spot vs perpetual, or aligning multiple timeframes, TradingView’s multi‑chart and compare features provide the flexibility you need. Save templates, enable the right sync options, and combine TradingView visuals with live exchange accounts to execute confidently. For live trading, register at reputable exchanges linked above and always validate your setup before risking capital.
Got a specific multi‑chart layout you want built (e.g., BTC/ETH stacked with RSI, OBV, and a correlation overlay)? Tell me the symbols and timeframes and I’ll give you a customized step‑by‑step layout to copy directly into TradingView.