Bitcoin vs Altcoin Graph Analysis 2025: Trends, Tools, and Strategies
Author: Jameson Richman Expert
Published On: 2025-11-10
Prepared by Jameson Richman and our team of experts with over a decade of experience in cryptocurrency and digital asset analysis. Learn more about us.
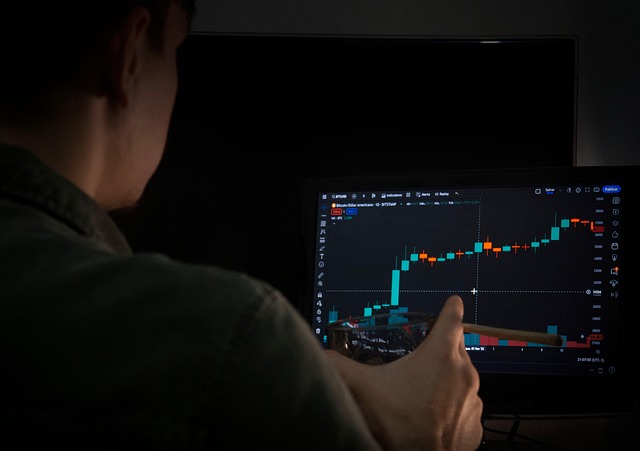
Bitcoin vs altcoin graph analysis is essential for traders and investors navigating crypto markets in 2025. This article explains how to read and interpret Bitcoin vs altcoin graphs, the indicators and metrics that matter, practical workflows for building comparison charts, and actionable strategies to trade or allocate capital based on observed patterns. You'll find step-by-step methods, examples from past cycles, and links to tools, educational resources, and exchanges so you can test setups immediately.

Why compare Bitcoin vs altcoin graph?
Comparing Bitcoin to altcoins using graphs helps you answer key questions: Is Bitcoin leading market direction? Are altcoins decoupling? When is an altcoin season likely to start or end? The visual representation of price, market cap, and dominance over time reveals rotation patterns, correlation changes, and relative strength—information critical for timing trades and portfolio adjustments.
Relevant high-authority background: learn more about Bitcoin on Wikipedia: Bitcoin and the broader category of altcoins on Wikipedia: Altcoin.
Key graphs to build and monitor
Below are the most useful Bitcoin vs altcoin graphs every trader should know:
- BTC Price vs Altcoin Price (Overlay): Plot BTC and a chosen altcoin (e.g., ETH, SOL, ADA) on the same time axis—normalized to the same starting point—to compare relative performance.
- BTC Dominance Chart: Percentage of total crypto market cap that Bitcoin represents. This shows when capital flows into or out of altcoins.
- Market Cap Ratio (BTC/ALT): Compare Bitcoin’s market cap to the combined altcoin market cap to quantify rotation.
- Correlation Heatmap / Rolling Correlation: Use rolling Pearson correlation (e.g., 30–90 days) between BTC and multiple altcoins to detect decoupling.
- Relative Strength (Bitcoin vs Altcoin): Create a BTC/ALT ratio price series; rising means BTC strength, falling means altcoin strength.
- Volume Comparison Graphs: Compare on-chain or exchange volume for BTC vs altcoins to confirm move legitimacy.
How to construct a clean comparison graph
- Choose a platform that supports multi-symbol overlays and ratio charts (e.g., TradingView).
- Normalize prices or use percentage change so different price scales are comparable.
- Add a BTC dominance or market cap series to provide context on capital allocation.
- Apply rolling-correlation indicators (30/60/90 days) to monitor changing relationships.
- Plot volume and volatility indicators (ATR) on a separate pane for confirmation.
If you use non-standard data sources or want to combine futures data, see practical connection workarounds such as connecting other platforms to TradingView in this guide about connecting Webull futures to TradingView: practical workarounds to link data feeds.
Interpreting Bitcoin vs altcoin graph signals
Reading these graphs effectively requires a combination of trend analysis, momentum confirmation, and structural context. Below are the most reliable signals:
1. Divergence between BTC price and BTC dominance
When BTC price rises but BTC dominance falls, that indicates capital rotating into altcoins despite Bitcoin strength—often a precursor to sharp altcoin rallies. Conversely, BTC price rising with rising dominance suggests BTC-led rallies and weaker altcoin performance.
2. Falling BTC/ALT ratio (relative strength)
A sustained decline in the BTC/ALT ratio often signals an emerging altcoin season. Use rolling averages on the ratio to filter noise—crosses below long-term EMAs are often early signals.
3. Changes in rolling correlation
A dropping correlation between BTC and certain altcoins suggests decoupling and independent altcoin trends. Watch for sustained correlation declines below 0.6 as a sign to analyze altcoin-specific catalysts.
4. Volume and volatility confirmation
Large volume spikes on altcoins concurrent with falling BTC dominance provide stronger evidence of real capital rotation. Low-volume altcoin moves risk being short-lived.

Altcoin season: identification and timing (2025 context)
“Altcoin season” is when altcoins significantly outperform Bitcoin. In 2025, market participants are watching macro conditions, BTC halving aftereffects, and sector-specific narratives (AI, L2s, DeFi) as drivers. For a deep dive into what altcoin season could look like in 2025 and metrics to identify it, read this comprehensive guide: What is Altcoin Season 2025 — complete guide.
Key metrics to determine altcoin season:
- BTC dominance dropping by >=5-10% over a sustained period.
- Top 100 altcoin aggregate market cap rising faster than BTC market cap.
- Multiple altcoins breaking to new local highs with volume confirmation.
- Sector-specific breadth—several projects within a theme (e.g., Layer 2s) rallying simultaneously.
Examples from past cycles: interpreting trends
Use historical examples to train pattern recognition. Two notable patterns appear repeatedly:
2017 ICO cycle
Bitcoin dominated early in the cycle, then dominance fell as ICO tokens rallied. Many tokens lacked fundamentals and collapsed when BTC corrected—illustrating the need for volume and fundamentals confirmation.
2020–2021 DeFi and NFT cycles
Bitcoin’s 2020–21 rally (and halving cycle) was followed by large altcoin rotations into DeFi and NFTs. BTC dominance fell while altcoin market caps and volumes surged. However, correlation remained positive; when BTC corrected in mid-2021, many altcoins followed down sharply—showing that altcoin rallies can be strong but remain vulnerable to BTC crashes.
Actionable strategies using Bitcoin vs altcoin graph
Below are tradeable strategies that use the bitcoin vs altcoin graph and related metrics. Each includes risk controls.
1. Momentum rotation strategy
Signals:
- BTC dominance falls and BTC/ALT ratio declines.
- Altcoin volume and price breakout confirmed on daily close.
Actions:
- Rotate a small portion of portfolio (5–15%) from BTC into selected altcoins with strong fundamentals.
- Set stop-loss at a defined percent or below breakout level to limit downside.
- Take partial profits on 2x–3x gains and re-evaluate.
2. Pairs trading (BTC vs Altcoin)
Signals:
- BTC relative strength becomes extreme—BTC/ALT ratio hits multi-month highs.
- Correlation metrics suggest mean reversion is likely.
Actions:
- Short BTC and long altcoin (or hedge by reducing BTC exposure and adding altcoin long exposure).
- Use tight risk management and monitor correlation; unwind if correlation breaks down further.
3. Rebalancing and risk parity
Signals:
- BTC rallies strongly and dominance increases; altcoins lag.
Actions:
- Rebalance to target allocations (e.g., 60% BTC / 40% altcoins) to lock in profits from BTC and maintain diversification.
- Use rebalancing triggers based on dominance or ratio thresholds rather than calendar rebalancing for better timing.

Technical indicators that improve graph interpretation
Combine price graphs with these indicators for higher-confidence decisions:
- Exponential Moving Averages (EMAs): 50/200 EMA cross on BTC/ALT ratio helps identify trend shifts.
- Relative Strength Index (RSI): Look at RSI on ratio charts—overbought/oversold in the ratio can precede rotation.
- MACD on ratio: Momentum crossover gives lead signals to a trend change between BTC and altcoins.
- On-chain metrics: Realized cap, active addresses, and exchange flows—use Glassnode or on-chain dashboards to confirm capital movement.
- Market breadth: Number of altcoins making new highs vs new lows confirms a genuine altcoin season.
Tools and platforms for building Bitcoin vs altcoin graphs
Recommended platforms:
- TradingView: Best for overlays, ratio charts, and custom scripts. Use multi-symbol features and build rolling correlation scripts.
- CoinMarketCap / CoinGecko: Good for market cap and dominance snapshots and historical cap charts.
- On-chain analytics: Glassnode, IntoTheBlock for on-chain confirmations.
- Exchange dashboards: Binance, Bybit, Bitget, MEXC offer matching data for traded volumes and order book context. Register via these referral links if you want to start trading easily: Register on Binance, Sign up on MEXC, Register on Bitget, Join Bybit.
If combining non-native data (e.g., futures from other platforms), check practical data connection approaches here: connecting external futures data to TradingView.
Backtesting and validation
Any strategy based on bitcoin vs altcoin graph signals should be backtested. Steps:
- Define entry/exit rules clearly (e.g., BTC dominance drop >5% in 30 days + daily altcoin breakout above EMA).
- Select sample period covering bull and bear markets (2017, 2020–21, 2022–2024, 2025 so far).
- Test on multiple altcoins and baskets to avoid single-asset overfitting.
- Measure metrics: win rate, max drawdown, Sharpe ratio, and average return.
- Run sensitivity analysis on parameters (EMA lengths, correlation window, dominance thresholds).
For a tactical trading framework and deeper strategy resources, consider this guidebook of trading strategies: Ultimate Crypto Trading Strategy Book Guide. It includes templates for backtesting and position sizing.
Risk management and portfolio construction
Key risk controls when acting on Bitcoin vs altcoin graphs:
- Position sizing: limit single-altcoin exposure (1–5% of portfolio) to reduce idiosyncratic risk.
- Stop-loss rules: fixed percentage or structure-based (below support, under EMAs).
- Hedging: use BTC positions or derivatives to hedge directional risk when holding altcoins.
- Liquidity consideration: prefer higher-liquidity altcoins to avoid slippage on entry/exit.
- Tax and jurisdictional awareness: confirm tax rules for short-term trades in your region.
When Bitcoin leads vs when altcoins decouple — decision matrix
Use this simplified decision matrix when you analyze the bitcoin vs altcoin graph:
| Condition | Interpretation | Suggested Action |
|---|---|---|
| BTC up, BTC dominance up | Market favors Bitcoin; altcoins likely to lag | Increase BTC allocation; reduce high-risk altcoins |
| BTC up, BTC dominance down | Rotation to altcoins despite BTC strength | Monitor altcoin breakouts; consider partial rotation |
| BTC down, BTC dominance up | BTC-led selloff; altcoins suffer more | De-risk; hedge using BTC or stablecoins |
| BTC down, BTC dominance down | Altcoins falling less or recovering; idiosyncratic strength | Analyze individual altcoin fundamentals; selective buys |
On-chain and macro overlays to complement price graphs
Price-only graphs can mislead. Add on-chain metrics and macro overlays:
- Exchange net flows: Net inflows to exchanges can signal selling pressure; net outflows often indicate accumulation.
- Realized cap & supply metrics: Track realized cap shifts and long-term holder behavior.
- Macro signals: Risk-on/off environment, interest rates, and liquidity conditions often drive crypto flows.
- Funding rates and open interest: High positive funding on altcoin perpetuals suggests crowd exuberance and higher crash risk.

Predicting cycle turns: where to look in 2025
Predicting exact cycle tops or the end of a bull run is difficult, but monitoring the bitcoin vs altcoin graph with macro context improves timing. For market-cycle analysis and projections for Bitcoin bull-run durations in 2025, this forecasting piece provides viewpoints and scenario planning: Predicting the Bitcoin Bull Run End Date. Combine those insights with BTC dominance trends and altcoin breadth for a robust view of cycle health.
Practical workflow: from graph to trade (step-by-step)
Follow this practical workflow to convert graph signals into disciplined trades:
- Open a BTC vs ALT ratio chart (or BTC dominance + chosen altcoins) on TradingView.
- Apply a 30/90-day rolling correlation and 50/200 EMAs to the ratio.
- Use volume filters—require daily volume > X baseline for chosen altcoins to avoid illiquid traps.
- Run the signal across a watchlist (top 20 altcoins) to create a ranked list of candidates.
- Paper trade or backtest the top signals for 3–6 months; adjust thresholds.
- Enter live trades with defined stop-loss and take-profit; size positions per risk management rules.
- Monitor and rebalance weekly; unwind if dominance or ratio reverses beyond stop triggers.
For traders wanting in-depth strategy playbooks and templates, the Ultimate Crypto Trading Strategy Book Guide is a useful resource with trade examples and position-sizing plans.
Examples of indicator combinations for bitcoin vs altcoin graph
Here are a few tested indicator combinations:
- Signal A (Momentum): BTC/ALT 50 EMA crosses below 200 EMA + daily altcoin volume spikes = altcoin rotation signal.
- Signal B (Mean Reversion): BTC/ALT ratio RSI above 80 (overbought) + negative divergence = potential pairs trade.
- Signal C (Trend Confirmation): BTC dominance rolling correlation < 0.6 with altcoin basket + altcoin 14-day RSI > 55 = sustained altcoin strength.
Common mistakes and how to avoid them
- Relying on one metric: Don’t trade on dominance alone—confirm with volume and price action.
- Ignoring liquidity: Small altcoins can spike on low liquidity and then crash; favor liquid pairs.
- Overleveraging: Derivative positions amplify correlation risk—use leverage sparingly when rotation is uncertain.
- Chasing late: Many traders enter altcoins after the first big move; use scaled entries and defined stop rules.
Educational resources and continued learning
To deepen technical skills and strategy knowledge, combine reading with backtesting and simulated trading. Good resources include crypto strategy guides, academic articles on market microstructure, and community-driven strategy repositories. For a compilation of strategy frameworks and a recommended reading path, check the trading strategy guide here: Ultimate Crypto Trading Strategy Book Guide.
Final checklist before executing a trade based on the bitcoin vs altcoin graph
- Confirm signal across price, volume, and dominance/ration charts.
- Check correlation and rolling-window behavior for decoupling confirmation.
- Review fundamental news or on-chain catalysts for the altcoin.
- Verify liquidity and order book depth on your chosen exchange.
- Set stop-loss, take-profit, and position size per risk rules.
- Document the trade thesis and outcome for post-trade review.

Conclusion
Mastering the bitcoin vs altcoin graph is a high-leverage skill for crypto traders in 2025. By combining ratio charts, dominance metrics, correlation analysis, and volume confirmation you can identify genuine altcoin rotation opportunities while managing downside risk. Use the practical workflows and strategy templates above to build a repeatable process, backtest rigorously, and always apply disciplined risk management.
Further reading and resources: practical data connection workarounds for TradingView and futures here, a deep dive on altcoin season 2025, cycle forecasting here, and strategy templates in the ultimate strategy guide. If you want to trade the signals discussed, consider registering on major exchanges using these links: Binance registration, MEXC signup, Bitget registration, and Bybit invite.
Use this guide as a framework—not a guarantee. Markets evolve, and continuous testing, learning, and adjustment are required to remain effective. Good luck, and trade responsibly.