Binance Trading Chart Live Pro Guide
Author: Jameson Richman Expert
Published On: 2025-11-06
Prepared by Jameson Richman and our team of experts with over a decade of experience in cryptocurrency and digital asset analysis. Learn more about us.
Binance trading chart live tools give traders real-time visual data to make faster, better-informed decisions. This comprehensive guide explains how to use Binance’s live charts, read candlesticks and order flow, apply indicators, backtest strategies, combine signals and dominance data, and manage risk — with step-by-step examples and trusted resources to level up your crypto trading.
Why live charts matter for crypto trading
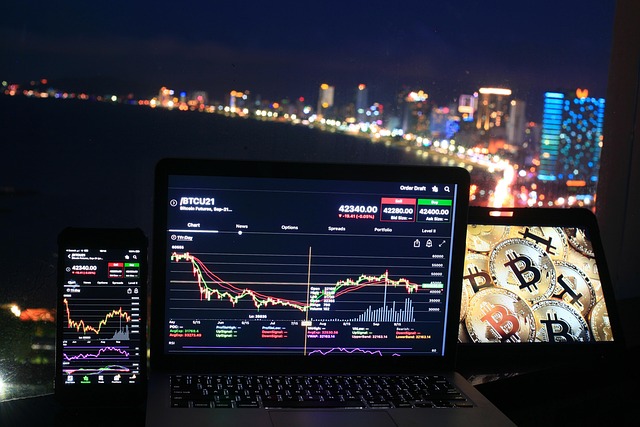
Live charts are the central interface where price action, volume, and market structure become visible. In fast-moving crypto markets, delays of seconds can change outcomes. A robust Binance trading chart live setup lets you:
- See real-time price movements and order flow
- Identify support/resistance, breakouts, and reversals
- Test and refine strategies quickly with accurate historical and live data
- Combine on-chart indicators with order book data for higher-probability entries
Where Binance’s live charts come from
Binance’s web and mobile trading interfaces use a professional charting engine (similar to TradingView) that supports multiple chart types, indicators, drawing tools, and order overlays. For deeper custom analysis, many traders pair Binance with TradingView directly.
Learn more about the foundations of technical charting from a reliable source like Wikipedia — Technical analysis or study candlestick patterns on Investopedia’s candlestick guide.
How to access Binance live charts (step-by-step)
Whether you’re on desktop or mobile, getting to a real-time chart on Binance is straightforward. Below are the primary access routes.
Desktop (web browser)
- Log in to your Binance account. New to Binance? Create an account through this referral link: Register on Binance.
- Open the "Markets" page or directly go to "Trade" and choose Spot, Margin or Futures depending on your product.
- Select a trading pair — e.g., BTC/USDT — the live chart opens automatically. Use the top-left pair selector to change markets.
- Customize chart type, timeframe, indicators and order overlays from the chart toolbar.
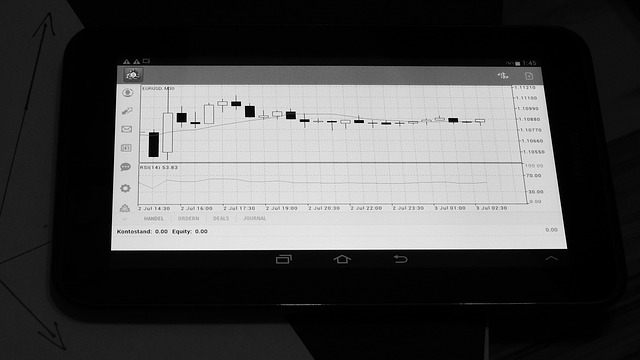
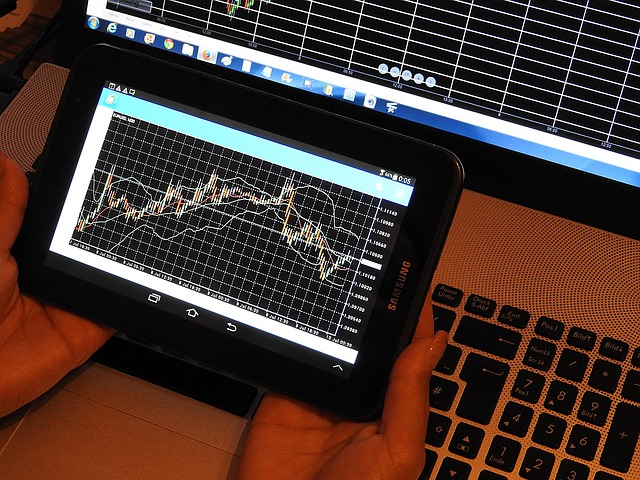
Mobile (Binance app)
- Open the Binance app, go to "Markets" or "Trade".
- Tap a trading pair to open the live chart. Full-screen chart and drawing tools are available on mobile.

Key components of the Binance trading chart live interface
Understanding each chart element helps you interpret signals faster.
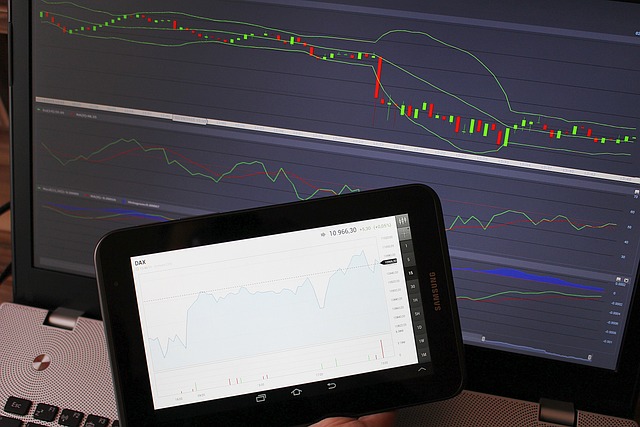
- Candlestick chart — Displays open, high, low, close (OHLC) per timeframe. Candlesticks reveal market sentiment.
- Timeframes — Common options: 1m, 5m, 15m, 1H, 4H, 1D. Use multiple timeframes to see trend context.
- Indicators — EMA, SMA, RSI, MACD, Bollinger Bands, Ichimoku, etc. Indicators should serve a purpose (trend, momentum, volatility).
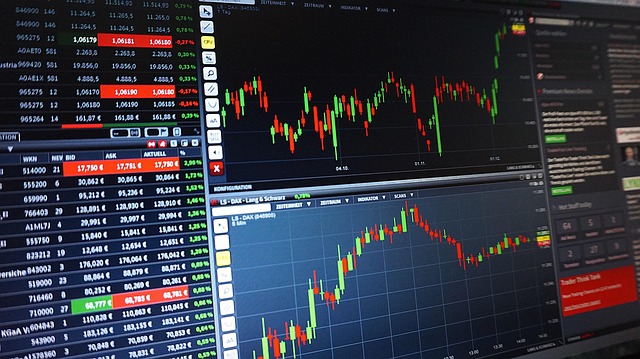
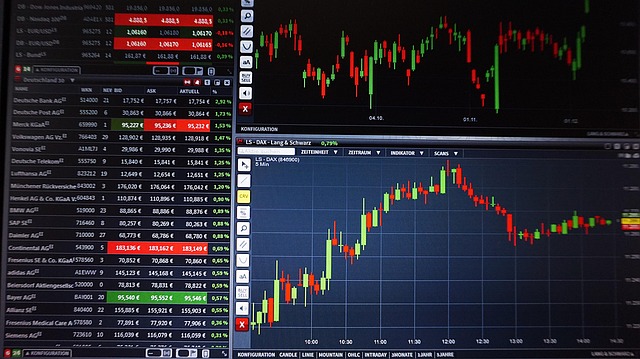
- Order book & depth chart — Shows real-time bids and asks; helps spot walls and potential liquidity zones.
- Recent trades (time & sales) — Displays executed market trades, size and price — useful for confirming momentum.
- Volume bars — Confirm moves: price moves on increasing volume carry more credibility.
Reading the chart: practical methods and examples
Below are practical ways to read and act on live charts, with clear examples.
1) Multi-timeframe analysis (MTFA)
Check the trend on a higher timeframe (daily/4H) and enter on a lower timeframe (15m/1H). Example:
- Daily shows an uptrend (higher highs and higher lows).
- Switch to 1H or 15m to find a pullback to the 20 EMA or a estruturing level.
- Enter on a bullish candlestick rejection or RSI bounce with confirming volume.
2) Support and resistance zones
Don’t rely solely on single lines—mark zones. Example: If price bounces three times from $40k on BTC/USDT, that forms a support zone. A live breakout with volume above resistance often signals continuation.
3) Order book confirmation
Before entering a breakout, peek at the depth chart. A strong pre-existing sell wall above price can slow a breakout unless absorbed by market orders. Time & sales confirm whether major buyers are stepping in.
4) Indicator-based entries
Use an indicator combo like EMA crossover + RSI confirmation. Example setup:
- EMAs: 9 EMA crosses above 21 EMA (momentum shift)
- RSI above 50 and rising (confirm momentum)
- Volume spike on crossover (confirm buying pressure)
Popular indicators and how to use them on live charts
Every indicator has strengths and limits. Use a small set tailored to your time horizon.
Moving averages (SMA & EMA)
EMAs are faster and favored for short-term trading. Use them for dynamic support/resistance and trend identification.
MACD
Good for momentum and divergence. Watch for MACD histograms shrinking before an apparent reversal.
RSI
Measures momentum. Look for divergence (price makes new high, RSI doesn’t) as an early reversal signal.
Bollinger Bands
Great for volatility regimes. Narrow bands indicate low volatility (often followed by expansion); price riding the upper band shows strong trend.
Backtesting and validating setups
Before risking capital on a live chart entry, backtest strategies using historical data. Backtesting helps you understand expectancy, win rate, and risk-reward. For a step-by-step backtesting approach, see this comprehensive guide on how to backtest a trading strategy effectively.
Key backtesting steps:
- Define clear entry, exit, stop-loss, and position sizing rules.
- Run historical tests across multiple market conditions (bull, bear, sideways).
- Evaluate metrics: net profit, max drawdown, Sharpe ratio, average trade.
- Forward-test on a demo account before live execution.
Using signals, bots and copy-trading with live charts
Many traders combine live chart analysis with trading signals or algorithmic bots. Signals can speed decision-making, but must be validated with your chart and risk rules. If you want an all-in-one toolkit that includes free forex and crypto signals, bots and copy trading tips, see this free forex and crypto trading signals VIP app guide.
Best practices when using signals/bots:
- Always cross-check signals against your live chart context (trend, key levels).
- Start small with bot allocations and keep manual override control.
- Prefer signal providers with transparent track records and verifiable performance.
To research top providers and compare options, view an expert review on who is the best crypto trading signal provider 2025.
Market structure and dominance — why it matters with live charts
Crypto often moves in correlation with Bitcoin dominance and overall market sentiment. Using dominance charts helps identify whether altcoins are likely to follow Bitcoin or rotate independently. For a detailed look at dominance mechanics and how to use them, consult this Bitcoin vs Altcoin dominance chart guide 2025.
Practical rule: In periods when BTC dominance is rising, favor BTC and BTC-pairs on your Binance trading chart live. When dominance falls and liquidity rotates, altcoin breakouts on live charts may produce outsized moves.
Advanced on-chart techniques: order flow, footprint and liquidity traps
Beyond candles and indicators, advanced traders monitor order flow to detect who controls price (buyers or sellers):
- Order book imbalance: Large bid clusters (green) can indicate hidden buy support; large ask clusters (red) signal resistance.
- Time & Sales sweeps: Sequences of market buy orders that lift the offer indicate aggressive buying and potential short-squeeze scenarios.
- Liquidity traps: False breakouts that target stop cascades; watch for rapid reversion and use wider stops or avoid until confirmation.
Example trade walkthrough (scalp to swing)
Example: Trading BTC/USDT on the Binance live chart.
- Context: Daily trend bullish; price near 1H support (20 EMA) and demand zone from prior consolidation.
- Lower timeframe (5m) shows a pullback with decreasing selling volume and a bullish engulfing candle on the live chart.
- Order book shows modest sell wall above — not enough to prevent breakout; time & sales show buyers absorbing asks.
- Entry: Buy market/limit at 1H support with a stop below the demand zone. Target: prior daily swing high for 2:1 R:R.
- Manage: Move stop to breakeven once price gains 1R; trail stop with EMA or higher timeframe structure.
Staking, yield and chart signals — the ETH connection
Live charts aren’t just for trading. For investors who stake or seek yield, combine price charts with protocol metrics. For example, when evaluating Ethereum staking decisions, you should also check current staking yields and network data. See this article on ETH staking rate today — where to find and understand for a clear explanation of staking rates and their market implications.
Choosing an exchange and opening accounts — quick guide
If you plan to trade using live charts across multiple exchanges (for liquidity and spreads), consider reputable options. Open accounts using these links if you want to get started quickly:
- Binance (spot & futures): Register on Binance
- MEXC: Register on MEXC
- Bitget: Register on Bitget
- Bybit: Register on Bybit
Multiple exchange access lets you compare order book depth, fees, and slippage for large orders.
Risk management: stops, sizing and psychology
Success on live charts depends as much on discipline as analysis.
- Position sizing: Don’t risk more than 1–2% of account capital on a single trade unless explicitly part of a strategy with a known expectancy.
- Stops: Use logical stops based on structure, volatility (e.g., ATR), or indicator invalidation — not arbitrary percentages.
- Trade journal: Record entries, exits, rationale, and screenshots of the live chart for every trade to refine your edge.
- Emotional rules: Avoid revenge trading, overtrading in low-probability setups, and position size creep after wins.
Technical setup and performance optimization
To keep your live chart experience fast and reliable:
- Use a wired internet connection or a quality mobile data plan.
- Close unused browser tabs and disable heavy extensions.
- Enable two-factor authentication (2FA) on exchange accounts for security.
- For automated strategies or heavy analysis, consider running a VPS with low latency to exchanges.
Regulation, taxes and compliance
Crypto trading has tax and regulatory implications in many jurisdictions. Keep accurate records of trades and consult reputable tax guidance relevant to your country. For official tax guidance, check your government revenue agency site or an accredited tax professional to ensure compliance.
Common mistakes when using Binance live charts (and how to avoid them)
- Overloading indicators: Too many indicators cause conflicting signals. Stick to 2–3 that serve clear roles (trend, momentum, volatility).
- Ignoring volume: Price without volume is weak. Always confirm breakouts with volume or order flow.
- Chasing entries: Wait for pullbacks or confirmations; late entries increase risk and reduce R:R.
- Neglecting fees & slippage: Factor fees and expected slippage into your edge calculations, especially on high-frequency setups.
Learning resources and communities
To refine chart skills, use structured resources and verified communities:
- Binance Academy — educational articles on trading basics and advanced topics (https://academy.binance.com)
- TradingView scripts and public ideas — learn by analyzing published strategies and scripts (https://www.tradingview.com)
- Signal & bot reviews — consult independent reviews like the one on best crypto trading signal provider 2025 before trusting paid services.
Putting it together: a daily routine for live-chart traders
- Pre-market / pre-session scan: Mark higher timeframe structure and key levels.
- Identify top 3-5 setups on live charts based on your strategy and risk rules.
- Monitor order book for liquidity changes that affect your planned entries.
- Execute trades with predefined stops and targets; log trades immediately.
- End-of-day review: capture screenshots, log outcomes, and note improvements.
Final checklist before trading on live charts
- Are the higher-timeframe trends aligned with your planned trade?
- Do indicators and volume confirm your entry?
- Is your position size appropriate for your risk limit?
- Are security measures (2FA, secure device) in place?
Further reading and specialized guides
To round out your skillset, study specialized topics:
- Backtesting fundamentals and methodology: how to backtest a trading strategy effectively
- Using signal apps, bots and copy-trading safely: free forex and crypto trading signals VIP app guide
- Evaluating providers and track records: best crypto trading signal provider 2025
- Market-wide context with dominance charts: Bitcoin vs Altcoin dominance chart guide 2025
- Staking & yield context for chart-based decisions: ETH staking rate today
Conclusion
Mastering the Binance trading chart live environment combines technical knowledge, disciplined execution, and a continual learning loop. Use multi-timeframe analysis, confirm moves with volume and order flow, validate strategies through backtesting, and keep disciplined risk management. Pair live charts with reliable signals and exchange tools where appropriate, but always validate externally and protect capital.
Ready to trade? Open accounts with trusted exchanges to begin practicing with real market data: Binance, MEXC, Bitget, Bybit.
Disclaimer: This article is educational and does not constitute financial advice. Cryptocurrency trading carries significant risk. Always do your own research and consider consulting a licensed financial professional.