Understanding Binance Trading Chart: A Comprehensive Guide for Traders
Author: Jameson Richman Expert
Published On: 2025-08-16
Prepared by Jameson Richman and our team of experts with over a decade of experience in cryptocurrency and digital asset analysis. Learn more about us.
The Binance trading chart is an indispensable tool that offers traders a dynamic visual representation of the often unpredictable cryptocurrency markets. It enables detailed analysis of price movements, trading volume, market sentiment, and technical patterns, forming the backbone of effective trading strategies. Given the high volatility and rapid price fluctuations characteristic of crypto assets, mastering Binance’s charting features—along with advanced analytical techniques—can significantly improve decision-making capabilities, optimize profitability, and mitigate trading risks. This comprehensive guide delves into the intricacies of Binance’s charting environment, explores advanced tools and techniques, discusses best practices, and highlights how leveraging educational resources and referral programs can expedite your path to trading success.
Introduction to Binance Trading Chart: Visualizing Market Data
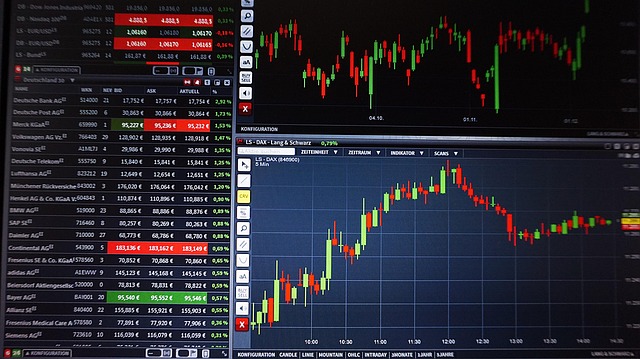
Binance’s trading interface provides a highly customizable and feature-rich charting platform that transforms raw market data into strategic insights. It supports multiple chart types—most notably, candlestick, line, and bar charts—each catering to different analytical styles. Candlestick charts are especially popular among traders due to their rich information content, depicting open, high, low, and close (OHLC) prices within specific timeframes, with color cues (green/white for bullish, red/black for bearish) that intuitively reflect market psychology. These visual cues help traders identify bullish and bearish trends at a glance, facilitating timely entry and exit decisions.
Customization options are vital for effective technical analysis. Traders can select from an extensive range of timeframes—from ultra-short periods like 1-minute and 5-minute intervals suitable for scalping and day trading, to weekly or monthly views that aid in long-term trend analysis and strategic planning. Interactive features such as zooming, panning, and the ability to draw trendlines, channels, and annotations create a highly adaptable environment for in-depth analysis. Real-time data feeds ensure traders remain synchronized with market developments, while multiple chart overlays—including technical indicators and pattern tools—enhance depth and predictive accuracy, allowing traders to craft nuanced strategies based on multi-faceted signals.
The Significance of Technical Analysis in Crypto Trading
In the volatile landscape of crypto markets, technical analysis (TA) is often the cornerstone of a trader’s decision-making process. TA involves scrutinizing historical price data, volume distributions, and various indicators to forecast future movements. Recognizable chart formations—such as head and shoulders, double tops and bottoms, ascending/descending triangles, flags, and pennants—serve as vital signals indicating trend reversals or continuations. Recognizing these formations early can mean the difference between a profitable trade and a missed opportunity.
Candlestick patterns deepen this insight, offering immediate clues about market sentiment shifts. For instance, hammer and inverted hammer patterns often signal potential bullish reversals, while shooting stars and dojis can indicate market indecision or impending reversals. Volume analysis further strengthens these signals: high-volume breakouts tend to be more trustworthy than low-volume ones, helping traders avoid false signals. Volume confirms the strength of price movements and pattern breakouts, serving as a critical filter in trade validation.
Indicators such as Relative Strength Index (RSI), Moving Average Convergence Divergence (MACD), Bollinger Bands, and Stochastic Oscillators are essential tools that help gauge overbought/oversold conditions, momentum shifts, and volatility. For example, RSI values above 70 or below 30 highlight potential reversals, while MACD crossovers can signal emerging trends. Bollinger Bands depict volatility expansion or contraction, alerting traders to breakouts or consolidations. Combining multiple indicators and pattern confluences creates a robust analytical framework—reducing false positives, increasing the likelihood of profitable entries and exits, and improving trade precision amid crypto’s inherent volatility.
Exploring Advanced Chart Features and Analytical Tools on Binance
Binance’s comprehensive suite of advanced charting tools empowers traders to fine-tune their strategies with precision and confidence. Fibonacci retracement and extension levels are among the most widely used overlays, especially during trending markets—they help identify potential reversal zones or target levels based on Fibonacci ratios such as 61.8%, 38.2%, and 78.6%. Derived from the Fibonacci sequence, these levels are respected by market participants and often serve as support or resistance points, guiding entries, stops, and take-profit orders.
Volume profile tools map traded volume across specific price ranges, revealing high-volume nodes that often act as support or resistance zones. These zones are critical because they indicate price levels where significant trading activity has historically occurred—making them prime candidates for strategic entries or exits. Trendlines, horizontal support and resistance, and geometric tools like channels, wedges, and rectangles help traders visualize market structure, identify breakouts, and confirm ongoing trends or reversals.
Additional features such as oscillators—including Stochastic, Awesome Oscillator, and RSI—offer insights into momentum and potential reversals. Divergences between price and oscillators often signal weakening momentum, hinting at upcoming reversals. For example, a bullish divergence in RSI during a downtrend suggests a potential reversal to the upside. Combining these tools with candlestick patterns, volume analysis, and chart formations provides a multi-layered analytical approach, especially useful in volatile assets like Bitcoin, Ethereum, and emerging altcoins.
Strategies for Effective Use of Binance Trading Charts
Harnessing Binance’s charting tools effectively requires disciplined routines, clear rules, and strategic planning. Developing a consistent trading process—such as waiting for confirmation of a breakout with accompanying high volume, or observing specific candlestick patterns at key support levels—helps reduce impulsive decisions. Risk management is paramount: setting predefined stop-loss and take-profit levels based on technical support/resistance, Average True Range (ATR), or Fibonacci retracement levels ensures that losses are minimized and gains protected.
Having a comprehensive trading plan with explicit entry criteria, risk parameters, and position sizing strategies is vital. Maintaining a detailed trading journal helps analyze past trades, understand what worked and what didn’t, and refine your approach over time. Practicing in demo or paper trading accounts allows you to hone your skills without risking real capital, which is essential for mastering chart reading and developing confidence in your strategies.
Furthermore, keeping abreast of macroeconomic news, regulatory developments, and market sentiment enhances contextual understanding of chart signals. Remember, no single indicator guarantees success—combining multiple signals, exercising patience, and adhering to disciplined risk management are crucial. Consistency, emotional control, and continuous learning form the pillars of long-term trading success.
The Power of Reliable Resources and Referral Programs
Engaging with reputable educational resources, active trading communities, and incentivized referral programs can significantly accelerate your trading journey. By registering on Binance through verified referral links—such as this Binance referral link—you can benefit from trading bonuses, fee discounts, and exclusive promotions. These incentives reduce trading costs and motivate ongoing engagement, which is crucial for continuous learning and strategy refinement.
Similarly, other major exchanges like MEXC, Bitget, and Bybit offer similar programs—often including educational webinars, trading challenges, and community mentorship—that can enhance your technical skills and market understanding. Participating actively in these communities provides social proof, networking opportunities, and peer support, all of which are invaluable for maintaining discipline and motivation.
Leveraging these platforms and resources ensures that your trading approach remains informed, disciplined, and adaptable, positioning you for sustained success amidst the fast-evolving crypto landscape.
Conclusion: Mastering Binance Trading Charts for Long-Term Success
Achieving mastery over Binance’s trading charts is a fundamental step toward becoming a skilled and profitable cryptocurrency trader. Understanding the various chart types, leveraging advanced analytical tools, and developing disciplined, rule-based trading strategies form the core of effective market participation. Incorporating educational content, engaging with trading communities, and utilizing referral programs not only provide motivation but also offer tangible benefits—reducing costs and accelerating learning.
As the crypto ecosystem continues to evolve rapidly, maintaining a commitment to ongoing education, continuous practice, and strategic refinement is essential. The ability to transform complex data into actionable insights—through patience, discipline, and adaptability—will determine your long-term success in the markets. With consistent effort and strategic use of Binance’s powerful charting suite, you can develop a nuanced understanding of market signals, minimize emotional trading, and cultivate a resilient trading mindset that sustains profitability over the years.