Understanding Binance Market Chart Analysis: An In-Depth Guide for Traders
Author: Jameson Richman Expert
Published On: 2025-08-15
Prepared by Jameson Richman and our team of experts with over a decade of experience in cryptocurrency and digital asset analysis. Learn more about us.
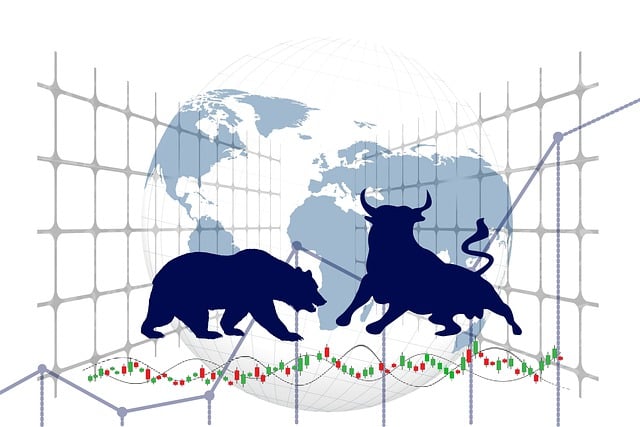
The Binance market chart is an indispensable tool for traders seeking to decode the complex and often volatile movements of cryptocurrency prices. These visual representations provide a comprehensive view of both historical and real-time data, enabling traders to identify prevailing trends, key support and resistance levels, and potential reversal or continuation points. Mastery of Binance chart analysis empowers traders to capitalize on emerging market opportunities while implementing robust risk management strategies. Given the highly dynamic, sentiment-driven nature of the cryptocurrency market—often influenced by macroeconomic events, regulatory news, technological advancements, and on-chain metrics—developing proficiency in chart analysis is essential for making informed and timely trading decisions that can significantly impact profitability and capital preservation.

Introduction to Binance Market Charts
Binance, as one of the world's largest and most reputable cryptocurrency exchanges, offers traders an advanced suite of charting tools embedded within its trading platform. These charts display live price movements across a vast universe of cryptocurrencies, including major assets like Bitcoin (BTC), Ethereum (ETH), and numerous altcoins. Beyond simple price tracking, Binance’s charting interface serves as a comprehensive analytical framework, allowing traders to evaluate market momentum, recognize intricate chart patterns, and gauge overall market sentiment with high precision.
Moreover, Binance provides users with customizable time frames—from as short as 1-minute charts suitable for scalping, to weekly or monthly charts ideal for macro analysis. Such flexibility enables traders to adapt their strategies to various trading styles, whether high-frequency trading, swing trading, or long-term investing. The platform also integrates a variety of technical indicators, drawing tools, and overlay options, empowering traders to conduct multi-layered analyses. This capability is fundamental for executing precise entry and exit points, optimizing trade timing, and devising strategic stop-loss and take-profit orders.
Types of Charts on Binance and Their Significance
Binance offers multiple chart types, each tailored to different analytical approaches and trader preferences, facilitating a multifaceted view of market conditions:
- Candlestick Charts: Widely regarded as the most informative, candlestick charts encapsulate four critical data points per period: open, close, high, and low prices. The visual cues—color coding with green (bullish/rising) candles and red (bearish/falling) candles—allow for rapid interpretation of market sentiment. Candlestick patterns such as doji, hammer, shooting star, engulfing, and morning/evening star formations can provide early signals of potential trend reversals or continuations. Recognizing these formations enhances traders' ability to anticipate shifts in momentum and adjust their strategies accordingly. Additionally, the length of candlestick bodies and wicks provides insights into market volatility and the strength of price moves.
- Line Charts: These plots connect closing prices over a specified period, offering a simplified view of price movement. While they lack intraday granularity, line charts are invaluable for quickly assessing overarching trends, identifying major support/resistance zones, and filtering out short-term market noise—particularly in long-term strategic analysis. They serve as an excellent starting point for macro trend identification before drilling down into more detailed chart types.
- Bar Charts: Display high, low, open, and close prices with vertical lines (bars) that include tick marks for open and close. Bar charts strike a balance between detail and visual clarity, making them preferred by traders who require granular intraday data for pattern recognition, particularly during volatile market phases. They offer a clear view of price ranges within each period and facilitate the analysis of price momentum and volatility.
Experienced traders often switch between these chart types or combine their insights with other technical and fundamental analysis tools. For example, overlaying candlestick patterns with volume indicators can improve signal reliability, while long-term line charts help confirm macro trends. Combining multiple chart types and analytical methods enhances the robustness of trading decisions, especially in volatile markets like cryptocurrencies.
How to Use Binance Market Charts for Effective Trading
Maximizing the utility of Binance market charts involves strategic application aligned with your trading style—whether active scalping, swing trading, or long-term investing. Effective chart analysis encompasses selecting appropriate time frames and integrating technical indicators for confirmation:
- Time Frame Selection: Short-term traders may analyze 1-minute or 5-minute charts to catch quick opportunities, while swing traders typically focus on 4-hour or daily charts to identify intermediate trends. Long-term investors often examine weekly or monthly charts to understand the fundamental macro directions, thereby avoiding the noise of short-term fluctuations. The choice of time frame directly impacts the types of signals you prioritize and the speed of decision-making.
- Technical Indicators: Several tools are essential for robust analysis:
- Moving Averages (MA): Simple Moving Average (SMA) and Exponential Moving Average (EMA) help smooth out price data to identify trend direction and strength. Crossovers of short-term (e.g., 20-day) and long-term (e.g., 200-day) MAs often signal trend shifts, alerting traders to potential entry or exit points. For example, a bullish crossover (short-term MA crossing above long-term MA) suggests upward momentum.
- Relative Strength Index (RSI): An oscillator measuring momentum, with readings above 70 indicating overbought conditions and below 30 indicating oversold states. Divergences between RSI and price can signal potential reversals, especially when combined with candlestick patterns.
- MACD (Moving Average Convergence Divergence): Analyzes trend momentum by comparing two exponential moving averages. Crossovers and the MACD histogram provide early signals of trend changes and momentum shifts, especially when used alongside volume analysis.
- Bollinger Bands: Volatility indicators that expand and contract based on market activity. When prices touch or breach outer bands, it may signal overextension—potential reversals or breakouts—particularly when confirmed with volume and other indicators.
Combining multiple indicators reduces false signals, improving overall analysis accuracy. For instance, a bullish breakout confirmed by high volume, a positive MACD crossover, and RSI divergence offers a robust buy signal. Conversely, divergences between volume and price can warn of weakening momentum. It’s also essential to consider external macroeconomic factors, such as regulatory decisions, macroeconomic data releases, or geopolitical events, which can rapidly influence market sentiment and invalidate technical signals.

Deep Dive into Technical Pattern Recognition on Binance Charts
Technical analysis extends beyond overlays and indicators into the realm of pattern recognition. Mastery of complex patterns enables traders to anticipate market moves with greater confidence:
- Head and Shoulders: A reversal pattern signifying a transition from bullish to bearish (or vice versa). It is characterized by a peak (head) flanked by two smaller peaks (shoulders). Its formation suggests weakening momentum and often indicates an impending trend reversal, especially when confirmed by volume decline and a break of the neckline.
- Double Top and Double Bottom: Major reversal patterns indicating potential trend shifts at key resistance or support levels. Double tops often herald bearish reversals after an uptrend, while double bottoms suggest bullish rebounds following a downtrend. Volume confirmation during the formation enhances reliability.
- Flags and Pennants: Short-term continuation patterns following sharp price movements. Flags appear as parallel channels, while pennants are small symmetrical triangles. Confirmed breakouts, especially with volume surge, typically lead to sustained trend continuation.
Volume analysis is critical: high volume on breakouts indicates strong conviction, whereas low volume may lead to false signals. Divergences such as a new high in price without volume confirmation can forewarn of weakening trend strength, signaling traders to exercise caution. Candlestick patterns like engulfing, star formations, or shooting stars further refine entry and exit points, especially when combined with pattern formations.
The Impact of External Factors and Market Sentiment
While technical charts provide vital insights, external factors significantly influence cryptocurrency prices. Major news events, regulatory updates, macroeconomic shifts, or geopolitical tensions can trigger sudden, sharp price movements that sometimes invalidate technical signals or accelerate trends unexpectedly.
To contextualize chart signals effectively, traders should incorporate market sentiment analysis—using social media trends, Google search interest, news sentiment scores, and on-chain data analytics. For example, a bullish technical pattern might be rendered irrelevant by an imminent regulatory crackdown, or a positive news breakthrough can reinforce and accelerate a breakout. Tools like sentiment analysis dashboards, Google Trends, and on-chain metrics (e.g., active addresses, transaction volume) help traders gauge the broader market mood and adjust their strategies accordingly.
Strategic Tips for Effective Binance Chart Analysis
Achieving consistent success requires discipline, strategic planning, and continuous education. Here are some practical tips:
- Define Clear Entry and Exit Criteria: Base your trades on specific patterns, indicator signals, and volume confirmation. Document your trading plan and stick to it, avoiding impulsive decisions driven by emotions.
- Implement Robust Risk Management: Use stop-loss orders to limit downside risk and take-profit orders to lock in gains. Adjust position sizes according to market volatility and your risk-reward ratio, typically aiming for at least a 2:1 reward-to-risk ratio.
- Maintain Emotional Discipline: Avoid FOMO (Fear of Missing Out) and panic selling. Rely on your analysis rather than hype or fear prevailing in the market.
- Backtest and Paper Trade: Use historical Binance data to evaluate your strategies across different market conditions. Practice with demo accounts to refine tactics without risking capital.
- Start Small and Scale Gradually: Begin with modest positions, especially when testing new strategies. As confidence and consistency grow, increase exposure systematically, preventing significant losses from early missteps.

Maximizing Binance Trading with Affiliate and Referral Programs
Beyond active trading, Binance’s affiliate and referral programs offer opportunities to generate additional income streams. By inviting new users through official links, you can earn commissions or bonuses, often complemented by promotional tools, trading bonuses, and exclusive offers. These programs are an excellent way to leverage your trading network, especially if you have a community or social media following interested in cryptocurrencies.
Register through official channels, such as Binance affiliate link. Similar programs are available on other major platforms like MEXC, Bitget, and Bybit. These platforms often feature deposit bonuses, trading competitions, and other incentives that, when combined with your technical skills and disciplined approach, can significantly enhance your overall profitability.
Conclusion
Mastering Binance market chart analysis is fundamental for any serious cryptocurrency trader aiming for long-term success. Developing a deep understanding of various chart types, technical indicators, complex pattern formations, and external market influences enables more accurate predictions and confident execution. Continuous education, disciplined practice, and staying informed about market developments are key to building a resilient trading strategy. When combined with fundamental insights, sentiment analysis, and robust risk management, technical chart analysis forms a comprehensive framework to navigate the crypto market’s inherent volatility. The ultimate key to sustained profitability lies in disciplined adaptation, ongoing skill refinement, and a holistic understanding of the multifaceted forces shaping cryptocurrency prices—ensuring traders are well-equipped to thrive amidst market uncertainties.