TradingView Chart Meaning: 2025 Practical Guide
Author: Jameson Richman Expert
Published On: 2025-10-24
Prepared by Jameson Richman and our team of experts with over a decade of experience in cryptocurrency and digital asset analysis. Learn more about us.
Understanding the tradingview chart meaning is essential for anyone who wants to read price action, identify trade setups, and make informed decisions in 2025. This comprehensive guide explains what each element on a TradingView chart represents — from candlesticks, timeframes, and volume to indicators, drawing tools, and alerts — and shows how to apply that knowledge with actionable examples for crypto and traditional markets.

What Is a TradingView Chart?
A TradingView chart is an interactive price chart powered by TradingView’s platform that displays market data over time. It visualizes how an asset’s price has moved (and is moving) using chart types such as candlesticks, bars, lines, Heikin-Ashi, and more. Knowing the tradingview chart meaning means understanding both the raw price information (open, high, low, close — OHLC) and the tools layered on top: indicators, overlays, drawing tools, and alerts used for technical analysis.
For background on the fundamentals of candlesticks and charting, see the Wikipedia entry on candlestick charts and technical analysis.
Core Components: OHLC, Candlesticks, Volume
OHLC explained
Every bar or candlestick on a TradingView chart encodes four primary values: Open, High, Low, and Close (OHLC). The open is the first traded price in the period, the close is the last, while high and low are the extremes. Reading OHLC is the first step to grasping the tradingview chart meaning.
Candlestick anatomy
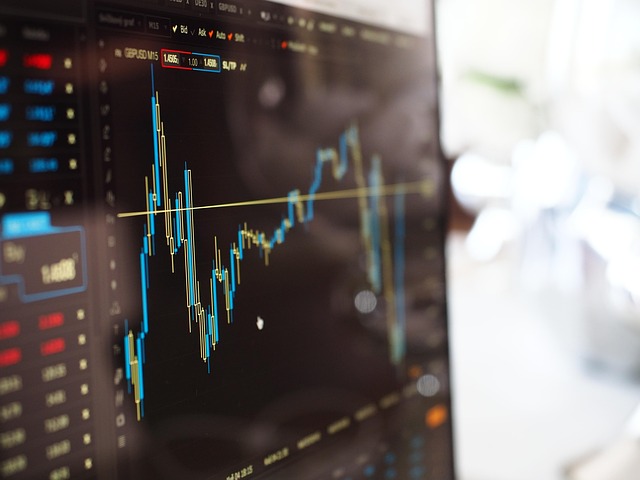
Candlesticks visually show bullish or bearish behavior. A green (or hollow) candle typically means the close > open (bullish), and a red (or filled) candle means close < open (bearish). The “body” shows the open-close range; the “wick” or “shadow” shows intra-period extremes. Recognizing patterns such as doji, hammer, or engulfing candles helps detect momentum shifts.
Volume
Volume bars below the chart reflect the number of contracts/shares/coins traded during each period. Volume confirms moves — higher volume on breakouts indicates strength, while low volume raises suspicion of false breakouts. TradingView also offers Volume Profile tools for distribution analysis.
Chart Types and Their Meanings
Different traders use different chart types depending on the strategy. Here are the most common options and when to use them:
- Candlestick — Most popular; shows OHLC and is best for price action and pattern recognition.
- Bars (OHLC bars) — Similar to candlesticks, favored by some technical analysts.
- Line chart — Connects closing prices; useful for a clean, long-term view.
- Heikin-Ashi — Smooths price action to highlight trends; reduces noise but slightly delays signals.
- Renko & Point & Figure — Focus on price movement, ignoring time; helpful for trend-only strategies and filtering noise.

Timeframes: Multi-Timeframe Analysis
The timeframe context changes the tradingview chart meaning significantly. A daily chart shows longer-term trends; a 5-minute chart shows short-term price behavior. Professional traders use multi-timeframe analysis — for example, identify trend direction on a daily chart and enter trades on the 1-hour chart. Always align trade direction on higher timeframes with lower timeframe entries to increase probability.
Example multi-timeframe approach
- Daily timeframe: Identify trend (uptrend/downtrend/sideways).
- 4-hour timeframe: Locate structure, support/resistance zones, and patterns.
- 1-hour or 15-minute: Fine-tune entry, use indicators for confirmation and place stop-loss orders.
Key Indicators and What They Mean on the Chart
Indicators are mathematical transforms of price and/or volume. They provide context about momentum, trend strength, volatility, and potential reversal points. Here are commonly used indicators on TradingView and their tradingview chart meaning:
Moving Averages (MA / EMA)
Moving averages smooth price data. The 50-period and 200-period simple moving averages (SMA) are widely used. Crossovers (e.g., 50 SMA crossing above 200 SMA) can signal a change in trend. Exponential moving averages (EMA) react faster to recent price moves and are common in shorter timeframe strategies.
Relative Strength Index (RSI)
RSI measures momentum on a 0–100 scale. Readings above 70 often point to overbought conditions, below 30 to oversold. Divergences between price and RSI (price makes new highs while RSI fails) can signal weakening momentum and possible reversals.
MACD (Moving Average Convergence Divergence)
MACD shows momentum and trend through histogram bars and signal line crossovers. A MACD line crossing above its signal line can be bullish; crossing below is bearish. Pay attention to histogram peaks and divergences for early signals.
Bollinger Bands
Bollinger Bands measure volatility using standard deviations around a moving average. Narrow bands (squeeze) indicate low volatility ahead of potential breakouts; wide bands signal high volatility and possible exhaustion.
Volume Profile & Order Flow (what TradingView shows)
Volume Profile highlights price levels with high traded volume (value areas) and low volume nodes (support/resistance). TradingView offers several volume profile tools, but for full order flow or footprint charts, dedicated platforms may be required.
Drawing Tools and Price Structure
Drawing tools are essential to interpret the tradingview chart meaning in terms of structure and levels:
- Trendlines — Connect highs or lows to define trend direction and channels.
- Support & Resistance — Historical areas where price has reacted. Use horizontal lines and rectangles for zones.
- Fibonacci retracement — Identify probable pullback levels (38.2%, 50%, 61.8%).
- Pitchfork and Channels — For trend-based strategies and identifying parallel support/resistance.
Actionable tip
When you mark support/resistance, prefer zones rather than exact lines. Price rarely reverses at a single tick — a 0.5–1.5% zone is more realistic for crypto; narrower for liquid FX or large-cap stocks.

Patterns: What They Mean for Price
Chart patterns convey information about supply/demand dynamics and potential future price movements. Some reliable patterns:
- Head and Shoulders — Potential reversal pattern after an uptrend.
- Double Top/Double Bottom — Reversal or failed trend continuation.
- Triangles (symmetrical, ascending, descending) — Often announce breakout direction; watch volume for confirmation.
- Flags and Pennants — Short consolidations within a trend, often lead to continuation.
Pine Script, Alerts, and Backtesting
TradingView’s Pine Script enables custom indicators and strategies. Understanding the tradingview chart meaning includes knowing how to code rules and backtest them on historical data. You can set alerts for price levels, indicator crossovers, or custom script events.
If you want to explore TradingView’s API options and integrations, review a detailed look here: Does TradingView Have an API in 2025? — In-depth Look.
Practical Examples: Reading TradingView Charts for Crypto
Below are concrete examples that combine price action, indicators, and risk management. These illustrate the tradingview chart meaning in real trading decisions.
Example 1 — Trend-following on Bitcoin (4-hour)
- Trend direction: 50 EMA above 200 EMA (uptrend confirmation).
- Retracement: Price pulls back to the 38.2% Fibonacci level confluence with 50 EMA and a previous support zone.
- Confirmation: RSI bounces from 45 and volume on the bounce increases vs pullback.
- Entry: Limit order near the confluence zone with stop-loss below the low of the pullback.
- Target: Take partial profits at prior resistance and trail stop for the remainder.
Example 2 — Mean-reversion on an altcoin (15-minute)
- Indicator: Price touches the lower Bollinger Band and RSI < 30 in a sideways market.
- Volume: No spike — a small mean-reversion play only.
- Entry: Small long position with tight stop below recent low.
- Risk: Keep position size small because mean reversion can fail in trending markets.

How TradingView Differs Across Data Sources
Charts may look different across platforms because of varying data sources, feed latency, or tick aggregation. A tick or minute chart from one exchange can vary from another. If you trade crypto, ensure you view the exact exchange’s data for execution-based analysis or compare aggregated data to avoid misinterpreting the tradingview chart meaning.
TradingView for Crypto Traders: Exchanges and Execution
TradingView is a visualization and analysis platform; execution can be done via integrated brokers or exchange APIs. For crypto traders ready to execute, popular exchanges include Binance, MEXC, Bitget, and Bybit. Use the following links to open accounts directly:
When using TradingView alongside these exchanges, double-check symbol suffixes (e.g., BTCUSDT vs BTCUSD) and data source to align analysis with execution.
Using TradingView Charts With Fundamental & On-Chain Data
The tradingview chart meaning expands when you combine technical charts with fundamentals or on-chain metrics. For example, when analyzing XRP’s possible use cases or long-term outlook in 2025, pair price structure with adoption news and on-chain metrics. Read an in-depth XRP analysis here: Will XRP Be Used in the Future of 2025? — In-depth Analysis.
Similarly, if you track layer-1 or altcoin fundamentals like Ethereum Classic, combine chart signals with fundamental projection articles for a fuller view: Ethereum Classic Price Prediction 2025 — By Month.

AI, Automation, and Advanced Analysis
Artificial intelligence can augment TradingView chart analysis by scanning many charts, spotting patterns, and suggesting probabilistic setups. If you’re interested in AI tools for market analysis that complement TradingView charts, see this analysis of AI apps for stock market analysis: AI App for Stock Market Analysis — Expert Perspective.
Backtesting and Strategy Validation
A crucial part of the tradingview chart meaning is validating that your interpretation works historically. Use TradingView’s strategy tester to:
- Convert a manual trading idea into a Pine Script strategy.
- Backtest across multiple markets and timeframes.
- Analyze metrics like profit factor, max drawdown, and win rate.
Backtesting helps you understand edge and sample-size limitations. Always forward-test a strategy in a demo or small live size before scaling.
Common Confusions and Troubleshooting
New users often misinterpret charts due to platform settings or expectations. Here’s how to avoid common mistakes:
- Different exchanges = different candles — Verify the symbol and exchange. Aggregated tickers can differ from a single exchange feed.
- Session and timezone — Day session settings affect daily opens/closes. Ensure timezone settings match your analysis plan.
- Heikin-Ashi vs Candlestick confusion — Heikin-Ashi alters OHLC; do not treat it like raw price for tight entries.
- Indicator default settings — Many indicators use default lengths (e.g., RSI 14). Customize them for your timeframe and asset.

Risk Management: Interpreting Charts Into Trades
Translating chart meaning into a trade requires risk controls:
- Position sizing: Use % of account or volatility-based sizing to control exposure.
- Stop-loss placement: Use structure (swing low/high) or ATR-based stops, not arbitrary levels.
- Reward-to-risk: Target setups with at least 1.5–3x reward-to-risk, depending on win rate and volatility.
- Leverage: If you use futures or margin, reduce position size and widen stops. Crypto leverage amplifies both gains and losses.
Practical Checklist: Before You Trade a Setup on TradingView
- Confirm trend on higher timeframe.
- Identify support/resistance zone; prefer confluence (EMA + Fib + prior swing).
- Look for indicator confirmation (RSI bounce, MACD cross, volume spike).
- Set stop-loss based on structure, not arbitrary percentage.
- Size the trade based on risk tolerance and position-sizing rules.
- Plan exits: target zones and trailing plan.
Advanced Tools & Third-Party Integrations
TradingView integrates with many brokers and data providers. For order automation and execution, explore API integrations (see the earlier API article linked above). For institutional-style analysis, use tools such as volume profile, session volume, and custom Pine Script indicators.
Where TradingView is limited
While TradingView is excellent for charting and most retail strategies, if you require full order flow, tape reading, or micro-structure tools, you may need specialized platforms that focus on footprint charts and direct exchange feeds.

Real-World Example: Combining Technical and Fundamental Analysis
Suppose you’re charting Ethereum Classic (ETC). The tradingview chart meaning identifies price structure and momentum. Combine that with a monthly fundamental forecast to see whether technical strength aligns with medium-term fundamentals. For a detailed monthly projection of ETC in 2025, refer to this analysis: Ethereum Classic Price Prediction 2025 — By Month.
Frequently Asked Questions (FAQ)
Q: What is the most important single element on a TradingView chart?
Price is the single most important element; everything else (indicators, drawings) is derived from or interprets price. Understand raw price points (OHLC) before relying on indicators.
Q: Why do charts look different on TradingView vs exchange UI?
Differences stem from tick data sampling, time aggregation, and exchange feed variability. Always confirm the exact symbol and exchange for execution-level analysis.
Q: Can TradingView predict market direction?
No tool predicts markets with certainty. TradingView charts provide probabilistic edge by visualizing past price behavior and indicator conditions. Combine chart signals with risk management to create an edge.
Next Steps — Tools to Start Applying This Knowledge
1) Open a chart on TradingView and label key elements: OHLC, support, resistance, and a moving average. 2) Add RSI and MACD; watch for divergences and crossovers. 3) Demo-trade a few setups or paper trade on your exchange of choice. If you’d like to get started on exchanges that integrate easily with analysis workflows, register here:

Conclusion — The Practical TradingView Chart Meaning for 2025
The tradingview chart meaning is a blend of raw price data (OHLC), visual forms (candlesticks, bars), contextual tools (indicators, volume, profiles), and your interpretative framework (support/resistance, patterns, risk rules). As markets evolve in 2025, the fundamentals of reading charts remain the same: focus on price, validate signals with volume and higher timeframes, and always manage risk. For deeper reading on related topics like TradingView API access, cryptocurrency-specific forecasts, and AI-powered market tools, see the linked resources throughout this guide.
If you want to explore additional resources, these articles expand on specific themes referenced above:
- Does TradingView Have an API in 2025? — In-depth Look
- Will XRP Be Used in the Future of 2025? — In-depth Analysis
- Ethereum Classic Price Prediction 2025 — By Month
- AI App for Stock Market Analysis — Expert Perspective
Mastering the tradingview chart meaning takes practice. Start with one setup type, document outcomes, refine rules, and scale only after consistent edge and controlled risk. Good luck and trade responsibly.