how to add multiple charts in tradingview: Step-by-Step Multi-Chart Setup Guide
Author: Jameson Richman Expert
Published On: 2025-11-09
Prepared by Jameson Richman and our team of experts with over a decade of experience in cryptocurrency and digital asset analysis. Learn more about us.
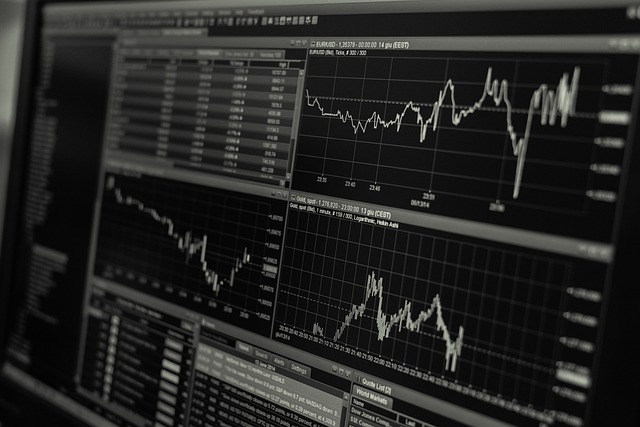
Learning how to add multiple charts in TradingView is essential for traders who want to monitor several assets, timeframes, or strategies at once. This guide walks you through every step—from choosing a layout and syncing symbols to saving templates and optimizing performance—so you can build a professional multi-chart workspace that speeds decision-making and reduces errors.

Why use multiple charts in TradingView?
Multiple charts let you:
- Compare related markets (BTC vs ETH, spot vs futures).
- View multiple timeframes (1H, 4H, Daily) side-by-side for multi-timeframe analysis.
- Test and monitor strategies across several symbols simultaneously.
- Keep charts organized with different indicators per pane for specific tasks.
Before we dive into how to add multiple charts in TradingView, note that the number of simultaneous charts you can open depends on your TradingView subscription. As of 2024, common limits are: Free = 1 chart, Pro = 2 charts, Pro+ = 4 charts, Premium = up to 8 charts. Always check TradingView’s official site for the latest plan details.
Quick overview — steps to add and manage multiple charts
- Select a multi-chart grid layout.
- Open or add symbols into each chart pane.
- Link charts to sync symbols, crosshairs, timeframes, or drawings.
- Apply indicator templates or duplicate setups across panes.
- Save your layout and create templates for fast recall.
Step-by-step: How to add multiple charts in TradingView (web/desktop)
1. Open TradingView and load the Chart page
Login to your TradingView account and click Chart from the top navigation. This loads the full-featured charting workspace where multi-chart layouts are managed.
2. Choose a layout (grid) for multiple charts
Locate the Select layout icon (grid icon) in the top toolbar. Click it and choose a grid arrangement that fits your workflow (2-up, 4-up, 6-up, etc.). The available grids depend on your subscription plan.
- Tip: If you need more charts than your plan allows, you can open additional browser tabs or separate windows as a workaround, though native sync features won’t work across tabs.
3. Add symbols to each chart pane
Each pane has its own symbol selector at the top-left of the pane. Click it and type the symbol, e.g., BTCUSD, ETHUSD, AAPL, etc. Press Enter to load the symbol in that pane.
- To replace a symbol quickly, click the symbol field and start typing the new ticker.
- Pro tip: Use your watchlist to drag symbols into panes for faster loading.
4. Link charts to sync symbols, timeframes, and drawings
One of the most powerful TradingView features is the ability to link charts so that actions on one affect all linked panes.
- Find the Chart Settings / Sync area or the small colored “link” icon in the top toolbar of each chart pane.
- Choose a link color (e.g., blue). Set the same color on all panes you want synced.
- Open the right-hand menu or the settings cog and enable sync options: Symbol, Crosshair, Timeframe, and Drawing tools. Each can be toggled independently.
Example: Set the link color to blue for two panes and enable Symbol & Timeframe. Now selecting BTCUSD in one pane will update the other pane to BTCUSD and the chosen timeframe.
5. Apply indicators and templates across panes
Rather than manually adding the same indicators to each pane, save them as an Indicator Template:
- Create your indicator setup on one pane (e.g., EMA(20), RSI(14)).
- Click the indicators menu > Template > Save Indicator Template.
- Open each pane, select Indicators > Template and apply it.
Alternatively, right-click an indicator and use Copy Indicator and then Paste Indicator into another pane where supported.
6. Save your chart layout
Once your multi-chart workspace is configured, click the Save icon (or press Ctrl/Cmd + S). Name your layout clearly (e.g., “Crypto Multi-Timeframe”) so you can quickly load it later from the Layout menu.
- Tip: Use versioned names (e.g., Crypto-MTF-v1) if you experiment with different setups.

Advanced techniques to enhance multi-chart workflows
Use templates for quick switching
Create different saved layouts and indicator templates for common tasks: “Scalping 1m/5m”, “Swing Daily/4H”, or “Correlation Watch”. This reduces setup time and ensures consistent analysis.
Multi-timeframe setups
Common multi-timeframe layouts include 4-up grids with 5m, 1H, 4H, and Daily. Link these panes by group but disable symbol sync if you want to view different assets simultaneously.
Correlated asset monitoring
To analyze correlations (e.g., BTC vs ETH, BTC vs S&P 500), load related symbols across panes and enable the Compare or Price Comparison feature in one pane to overlay relative price action.
Pop-out charts and multiple monitors
If you trade with multiple monitors, detach or pop-out charts (if supported by your browser and TradingView plan) into separate windows and place them on different screens. This provides maximum visibility and control.
Use the Watchlist and Alerts effectively
- Add instruments to a structured watchlist so you can drag-and-drop symbols into panes.
- Create alerts from any pane. Alerts will trigger regardless of which layout is open, so keep important order/price alerts active while switching layouts.
Mobile and tablet use — limitations and tips
TradingView’s iOS and Android apps are feature-rich but may limit the number of charts you can view simultaneously depending on screen size. Tablets often provide better multi-chart experiences than phones. If you need full multi-chart functionality on the go, access TradingView via a tablet browser or the desktop site if your device supports it.
Common issues and troubleshooting
1. Grid options grayed out
If you can’t select a multi-chart grid, you likely need a plan with a higher chart layout limit. Check your subscription under Profile > Account and upgrade if necessary.
2. Charts not syncing
Ensure the link color on each pane is set to the same value and that sync options (symbol, time, crosshairs, drawings) are enabled in the chart settings.
3. Slow performance or lag
- Reduce the number of heavy indicators (e.g., multiple multi-period MAs, scripting-based indicators).
- Close unused browser tabs and extensions that use CPU.
- Lower the chart resolution (e.g., fewer bars on the chart) or disable animations.
4. Layout not saving
Make sure you’re logged into your account and have sufficient storage for saved layouts. Press Ctrl/Cmd + S after changes. If issues persist, clear browser cache or try a different browser.

Practical examples and workflows
Example 1 — Crypto multi-timeframe trading
Layout (4-up): 15m, 1H, 4H, Daily. Link symbol and timeframe for the 15m and 1H panes (same color) and link 4H/Daily in a different color to keep daily-level perspective synced separately.
Indicator setup: 20 EMA + 50 EMA on intraday panes; MACD on 1H; RSI on 4H/Daily. Save as “Crypto MTF” template.
Example 2 — Spot vs. Derivatives
Layout (2-up): Left pane = Spot pair (BTCUSD), Right pane = Perpetual futures (BTCUSD-PERP). Link symbols but disable drawing sync so you can draw different trade entries on each.
Use order entry options integrated with brokers (if connected) to compare funding rates, spread, and entry pricing.
Integrations, broker links and useful resources
TradingView integrates with several brokers and platforms for order execution and market data. If you’re opening exchange accounts to trade directly from TradingView, consider reputable platforms that support TradingView or have strong API integrations.
- Binance (signup): Create a Binance account
- MEXC (signup): Register at MEXC
- Bitget (signup): Join Bitget
- Bybit (signup): Sign up at Bybit
For deeper market commentary and trade ideas, check expert guides and analyses. For example, see this Ethereum sell/hold guide for 2025: Should you sell Ethereum now? — Expert Guide 2025. For platform recommendations and reliability discussion, refer to Most reliable trading platform — Reddit top picks 2025. If you’re interested in social/copy trading legality and compliance, this guide is helpful: Is copy trading legal? — Legality, regulations and compliance.
Performance optimization tips
- Use fewer drawing objects and limit auto-updating indicators when running many panes.
- If your browser struggles, try the TradingView desktop app (Electron-based) which can be more stable with multiple windows.
- Use indicator templates rather than dozens of individual indicators to reduce resource usage.
- Load only the symbols you’re actively trading; remove inactive charts from the layout.

Keyboard shortcuts and productivity hacks
- Ctrl/Cmd + S: Save layout.
- Alt + W: Open watchlist (varies by setup).
- Right-click any indicator to copy or open settings quickly.
- Customize shortcuts in the TradingView settings for commonly used tools.
Security and best practices
When connecting broker accounts or using API keys for direct trading from TradingView, follow security best practices:
- Enable two-factor authentication (2FA) on exchange and TradingView accounts.
- Use API keys with permissions limited to the actions you need (e.g., disable withdrawals).
- Monitor account activity and set notification alerts for logins or unusual activity.
Additional learning resources (high-authority)
To improve chart-reading skills and technical analysis knowledge, consult authoritative sources:
- Technical analysis overview (Wikipedia): Technical analysis — Wikipedia
- Indicator definitions and trading basics (Investopedia): Investopedia: Technical Analysis
- TradingView official help and tutorials: TradingView Support

Frequently asked questions (FAQ)
Q: How many charts can I open at once?
A: Chart limits depend on your TradingView plan. As of 2024, Free = 1, Pro = 2, Pro+ = 4, Premium = 8. Check TradingView’s pricing page for updates.
Q: Can I sync drawings across charts?
A: Yes—enable drawing sync in the sync options. This allows trendlines, annotations, and other drawings to appear across linked panes.
Q: Can I trade directly from TradingView on multiple charts?
A: If your broker is integrated with TradingView (e.g., supported brokers), you can place orders directly. Connect your broker account in the Trading Panel and ensure API permissions are correctly configured.
Q: How do I save different multi-chart workspaces for different strategies?
A: Build the layout and indicator setup, then save it with a meaningful name (Ctrl/Cmd + S). Create multiple saved layouts for each strategy and recall them from the layout menu.
Final checklist before trading with multiple charts
- Confirm your TradingView subscription supports the desired grid size.
- Set up watchlists and templates for fast symbol swapping.
- Enable necessary sync options (symbol/timeframe/drawings/crosshair).
- Save layouts and backup key configurations.
- Secure broker/API accounts with 2FA and permission controls.
Summary
Mastering how to add multiple charts in TradingView elevates your trading—letting you compare markets, execute multi-timeframe analysis, and monitor positions in one efficient workspace. By choosing the right layout, using chart linking and templates, optimizing performance, and saving layouts, you’ll build a reliable, repeatable setup tailored to your strategies. For related market insights, platform reliability, and legal considerations for copy trading, see the linked expert resources above. If you’re opening exchange accounts for live trading, consider the reputable platforms listed earlier and follow security best practices.
Ready to build your multi-chart workstation? Start by selecting a layout and saving a clean, labeled template—then iterate until it matches your trading rhythm.