Crypto Trading Indicators Explained: Ultimate Guide
Author: Jameson Richman Expert
Published On: 2025-11-09
Prepared by Jameson Richman and our team of experts with over a decade of experience in cryptocurrency and digital asset analysis. Learn more about us.
Crypto trading indicators explained — this guide breaks down the most popular technical indicators, how they work, and exactly how to use them in volatile cryptocurrency markets. You’ll learn the theory behind trend, momentum, volatility, and volume indicators, see actionable strategy examples, get recommended indicator settings for crypto, and discover best practices for backtesting, risk management, and choosing exchanges and charting tools.
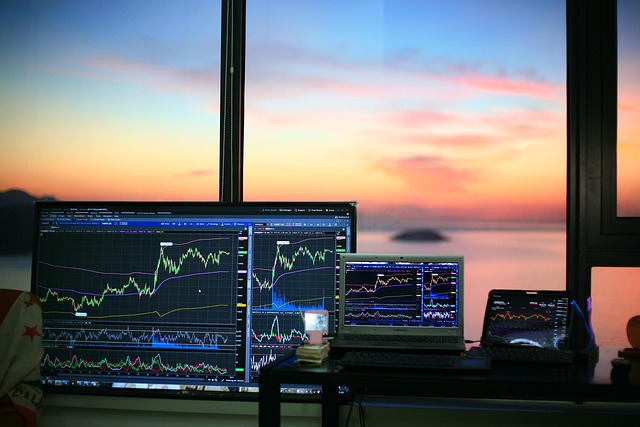
Table of contents
- What are crypto trading indicators?
- Types of indicators
- Key indicators explained (with examples)
- How to use indicators in crypto trading
- Practical indicator-based strategies
- Recommended indicator settings for crypto
- Backtesting and avoiding overfitting
- Risk management & leverage
- Where to trade — exchanges & fees
- Final tips and resources
What are crypto trading indicators?
Technical indicators are mathematical calculations applied to price, volume, or open interest data to help traders interpret market behavior and generate trade signals. Indicators transform raw market data into visual overlays or oscillators that highlight trends, momentum, volatility, and strength. Because cryptocurrencies often have higher volatility and 24/7 trading hours, indicators require careful tuning and interpretation compared to traditional assets.
For an overview of the academic and practical background of technical analysis, see the Wikipedia article on Technical analysis.
Types of indicators
Indicators are typically grouped by what they measure:
- Trend indicators — identify the market direction (e.g., Moving Averages, Ichimoku).
- Momentum indicators — measure the speed of price movement (e.g., RSI, Stochastic).
- Volatility indicators — quantify price dispersion (e.g., Bollinger Bands, ATR).
- Volume indicators — assess buying and selling pressure (e.g., OBV, VWAP).
- Strength/confirmation indicators — evaluate trend strength (e.g., ADX, MACD histogram).
Key indicators explained (with examples)
Moving Averages (SMA & EMA)
Moving averages smooth price data to reveal the underlying trend. The Simple Moving Average (SMA) is the arithmetic mean of recent prices; the Exponential Moving Average (EMA) weights recent prices more heavily, which can be helpful in fast-moving crypto markets.
- Common EMA periods: 9, 21, 50, 100, 200.
- Example use: A bullish crossover (short EMA crossing above long EMA) suggests trend change upward; bearish crossover suggests downward trend.
Relative Strength Index (RSI)
RSI is a momentum oscillator that ranges from 0 to 100. Default period is 14. Traditionally, RSI >70 indicates overbought, <30 indicates oversold. In volatile crypto markets, those thresholds can be adjusted (e.g., 80/20 for strong trends).
Actionable use: Look for RSI divergences (price makes new high but RSI does not) as an early warning of trend exhaustion.
Learn more about RSI on Investopedia.
MACD (Moving Average Convergence Divergence)
MACD is the difference between two EMAs (commonly 12 and 26) and a signal line (9-period EMA of MACD). The MACD histogram shows momentum. Crossovers of the MACD line and signal line generate trade signals; histogram divergences can signal weakening trend.
Bollinger Bands
Bollinger Bands consist of a middle SMA (usually 20) and upper/lower bands at a set number of standard deviations (often 2). Bands expand during high volatility and contract during low volatility (squeezes).
- Breakouts following a squeeze often lead to strong moves — use volume or momentum confirmation.
- Mean-reversion plays: Price touching the upper band may be overextended in range markets.
Average True Range (ATR)
ATR measures volatility — the higher the ATR, the larger typical price moves. Traders use ATR to set dynamic stop-loss and position size (e.g., ATR-based stop a multiple of ATR away).
VWAP (Volume Weighted Average Price)
VWAP gives an intraday average price weighted by volume. Institutional traders use VWAP for execution benchmarks. For intraday crypto trading, VWAP helps determine value zones and intraday support/resistance.
On-Balance Volume (OBV)
OBV cumulatively adds/subtracts volume based on price direction, aiming to show whether volume confirms price. Rising OBV with rising price confirms an uptrend; divergence warns of potential reversal.
Stochastic Oscillator
The Stochastic compares closing price to a range over a period (default 14). It ranges 0–100; readings >80 are overbought, <20 oversold. Stochastic is often used with RSI to confirm momentum exhaustion.
ADX (Average Directional Index)
ADX measures trend strength (0–100). Readings >25 typically indicate a strong trend; <20 suggests a ranging market. ADX is helpful to decide whether to trade trend-following systems or mean-reversion strategies.
Ichimoku Cloud
Ichimoku combines multiple lines (Tenkan-Sen, Kijun-Sen, Senkou Span A/B, Chikou Span) to provide trend, momentum, and support/resistance at a glance. It’s popular for capturing longer-term structure and breakout zones on crypto charts.
Fibonacci Retracement
Fibonacci levels identify potential support/resistance based on common retracement ratios (23.6%, 38.2%, 50%, 61.8%). Traders use them with confluence from moving averages or pivot points to locate high-probability entries.
How to use indicators in crypto trading (practical rules)
Individual indicators are rarely sufficient alone. The best practice is to combine complementary indicators and consider timeframes, volatility, and market context.
- Use one trend indicator + one momentum indicator + volume confirmation. Example: 21 EMA (trend) + RSI (momentum) + OBV (volume).
- Confirm across timeframes. If you trade 1-hour charts, check 4-hour and daily trends for alignment.
- Adjust settings for crypto volatility. Wider ATR and higher RSI thresholds can reduce false signals.
- Be aware of lag. Many indicators are lagging (moving averages), so combine with leading indicators (RSI/Stochastic) for timing.
- Volume matters in breakouts. A breakout without volume is more likely to fail.
Example: Trend-following entry
- Confirm daily trend with 50 EMA above 200 EMA.
- On 1-hour chart, wait for 9 EMA to cross above 21 EMA.
- RSI rebounds above 50 and OBV is rising — enter on candle close above resistance.
- Set stop-loss below recent swing low or ATR multiple.
Example: Mean-reversion entry
- Price touches lower Bollinger Band on a 4-hour chart.
- RSI < 30 and Stochastic < 20 (oversold condition).
- Volume is not spiking aggressively (no capitulation) — enter a countertrend trade with tighter targets.
Practical indicator-based strategies for crypto
Below are three concrete strategies you can test and adapt. Remember to backtest before live trading.
1) EMA Crossover with ATR Stop
- Indicators: 9 EMA, 21 EMA, ATR(14).
- Entry: 9 EMA crosses above 21 EMA on 1-hour chart and price above 50 EMA on daily chart.
- Stop: ATR(14) x 1.5 below entry or below recent swing low.
- Take profit: Risk:Reward 1:2 or trail with EMA cross back.
2) RSI Divergence Reversal
- Indicators: RSI(14), MACD histogram, OBV.
- Entry: Price makes lower low but RSI makes higher low (bullish divergence) and OBV supports accumulation.
- Stop: Below swing low. TP: near resistance or based on Fibonacci level.
3) Bollinger Band Squeeze Breakout
- Indicators: Bollinger Bands(20,2), Volume, VWAP (intraday).
- Entry: Prolonged squeeze (contraction of bands) followed by breakout candle with above-average volume and price closing above VWAP (if intraday bullish).
- Stop: Back below breakout candle low. TP: use measured move equal to band width.

Recommended indicator settings for crypto
Default indicator settings were designed for stocks/FX; crypto's higher volatility and 24/7 trading justify adjustments:
- EMA: Short-term 9–21, mid-term 50–100, long-term 200.
- SMA: 50 and 200 for trend confirmation on daily charts.
- RSI: 14 default; consider 80/20 in strong trends or 10–14 for faster signals.
- MACD: 12/26/9 default; use on daily/4H for clearer signals.
- Bollinger Bands: 20, 2 default; monitor band width for squeezes.
- ATR: 14 for stop sizing (multiply by 1.5–3 depending on volatility).
- Stochastic: 14,3,3 default; useful for range markets.
Backtesting and avoiding overfitting
Indicator-based systems often perform well on historical data but fail in live markets if overfitted. Follow these backtesting best practices:
- Use out-of-sample testing: train parameters on one time period, test on another.
- Keep the strategy simple: fewer indicators reduce the chance of curve-fitting.
- Use realistic costs (spreads, slippage, funding fees) in backtests — crypto markets have higher fees and spreads at times.
- Test across multiple coins and market regimes (bull, bear, sideways).
For guiding material on price prediction techniques and community insights, you may find this Best Crypto Price Prediction Reddit Guide useful when combining sentiment with indicators.
Risk management & leverage
Indicators tell you when to consider entering or exiting, but risk management controls survival. Key rules:
- Risk a fixed % of capital per trade (commonly 0.5–2%).
- Use ATR to set stops that respect volatility.
- Keep position sizes consistent with your risk tolerance.
- Use leverage cautiously — crypto leverage amplifies both gains and losses.
If you use margin or leverage, understand how to manage it dynamically. For a practical guide on changing leverage on Bybit (useful for position sizing and risk control), see this Bybit leverage guide.
Also note that fees and funding can erode returns when using margin. Review exchange fee structures before high-frequency or leveraged strategies — here is a detailed resource on Binance fees and margin trading: Complete Guide to Binance Fees & Margin.

Where to trade — exchanges, charting platforms, and fees
Your choice of exchange and charting platform influences execution quality and available indicators. Popular exchanges include:
- Binance — deep liquidity and many margin products.
- MEXC — altcoin variety and futures.
- Bitget — derivatives and copy trading features.
- Bybit — derivatives with advanced risk controls.
Charting tools like TradingView are industry-standard for indicator customization and alerts. Visit TradingView to set up watchlists and indicator templates.
If you plan long-term investing rather than active trading, indicators play a supporting role to fundamentals. For long-term selection ideas in India and strategy insights, this resource can help: Which Crypto to Buy Today — India Long-Term Guide.
Final tips and resources
- Avoid indicator overload: Too many indicators create conflicting signals. Use a concise combo — trend + momentum + volume.
- Align timeframes: Trade in the direction of the higher timeframe trend for higher probability trades.
- Monitor market structure: Higher highs/lows and lower highs/lows matter more than any single indicator.
- Keep a trade journal: Record setups, indicators used, outcomes, and lessons to refine your edge.
For community sentiment and crowd-based predictions, pairing technical indicators with sentiment analysis can provide additional context. See the Reddit-based price prediction guide referenced earlier for ways to incorporate community signals: Best Crypto Price Prediction Reddit Guide.
Putting it into practice — a 5-step checklist
- Define the timeframe and goal (scalp, swing, position).
- Choose a simple indicator set: one trend (EMA), one momentum (RSI), one volume (OBV/VWAP).
- Confirm trade with higher timeframe trend and volume confirmation.
- Set stop and position size using ATR-based volatility sizing.
- Backtest, paper trade, then deploy small size live — increase only after consistent edge.

Useful reading & authoritative references
Next steps
If you’re ready to practice on a live exchange, consider opening accounts on reputable platforms with good liquidity and risk controls. Use these links to register:
- Binance: Open Binance account
- MEXC: Open MEXC account
- Bitget: Open Bitget account
- Bybit: Open Bybit account
Finally, remember that indicators are tools — not guarantees. Combine them with sound risk management, continuous learning, and disciplined execution. For an integrated approach combining on-chain, sentiment, and technical tools, explore long-term selection and strategy resources like the crypto long-term guide, and keep refining your system with the leverage and fee guides linked above.
Good luck, and trade responsibly.