Binance Trading Chart Analysis Techniques
Author: Jameson Richman Expert
Published On: 2025-09-08
Prepared by Jameson Richman and our team of experts with over a decade of experience in cryptocurrency and digital asset analysis. Learn more about us.
Understanding Binance trading chart analysis is a cornerstone for traders aiming to navigate the highly volatile and fast-paced cryptocurrency markets successfully. In a realm characterized by rapid price fluctuations and complex market signals, mastering chart analysis not only improves entry and exit timing but also enhances your ability to anticipate market shifts, manage risk effectively, and develop a disciplined trading approach. This comprehensive guide explores advanced technical analysis tools, detailed pattern recognition, strategic multi-layered approaches, and subtle market considerations crucial for maximizing trading performance on Binance, one of the world's leading crypto exchanges known for its extensive trading pairs, real-time data, and innovative features.
The Foundation of Binance Chart Analysis: Chart Types and Their Significance
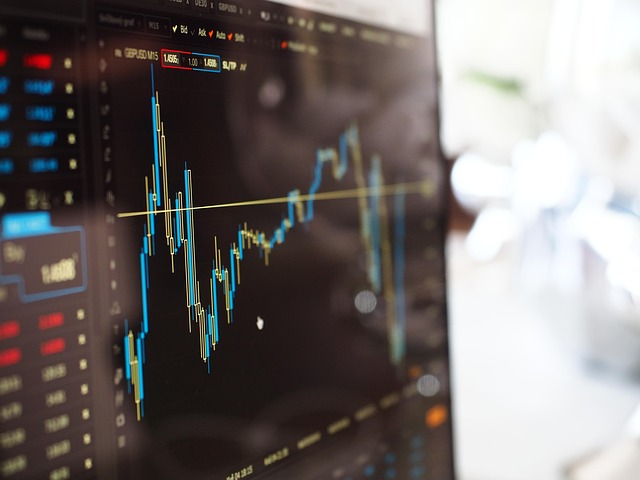
The initial step toward sophisticated Binance trading is understanding the primary chart types favored by traders worldwide. The most prevalent are candlestick charts, line charts, and bar charts, each offering unique insights. Candlestick charts, in particular, are invaluable because they encapsulate four key price points—open, high, low, and close—within a specific timeframe, forming recognizable patterns that serve as predictive signals. Recognizing patterns such as bullish engulfing, doji, hammer, shooting star, and spinning top requires dedicated practice but can significantly refine timing and accuracy in trades. Moreover, advanced traders often employ multi-timeframe analysis—integrating daily, 4-hour, 1-hour, or even 15-minute charts—to capture macro trends alongside short-term signals. This layered approach helps filter out market noise, validate trend directions, and pinpoint optimal entry and exit zones, reducing the likelihood of false signals caused by noise or fleeting volatility.
Core Technical Indicators and Their Advanced Applications
Beyond basic chart types, the strategic application of technical indicators elevates analysis accuracy. While many traders rely on moving averages, RSI, MACD, Bollinger Bands, Fibonacci retracement, and volume metrics, advanced traders deepen their understanding by combining these tools to create robust confirmation systems. Here's an in-depth look at these indicators and their nuanced use:
- Moving Averages (MA): Both simple (SMA) and exponential (EMA) moving averages serve as dynamic support/resistance levels and trend direction indicators. Advanced traders analyze the slope, curvature, and spacing of MAs—such as 9, 21, 50, 200—to assess trend strength and potential reversals. The use of crossovers like the Golden Cross (e.g., 50 EMA crossing above 200 EMA) and Death Cross (opposite) serve as significant signals when confirmed with volume and price action. Additionally, MAs can be used as dynamic zones for setting stops or targets, especially when combined with other oscillators.
- RSI (Relative Strength Index): While the conventional overbought (>70) and oversold (<30) levels are useful, advanced traders look for divergence signals—where RSI fails to confirm new highs or lows in price—indicating waning momentum and possible reversals. Using RSI in conjunction with stochastic oscillators, such as the Stochastic RSI, refines timing further. Overbought or oversold conditions in multiple oscillators, combined with divergence, strengthen trade signals.
- MACD (Moving Average Convergence Divergence): Beyond simple crossovers, traders analyze MACD histogram shifts, zero-line crossovers, and divergence with price action. For example, a bullish divergence where price makes lower lows but MACD histogram makes higher lows signals weakening bearish momentum, often preceding trend reversals. Analyzing the slope of MACD lines and their convergence/divergence with volume adds further confirmation.
- Bollinger Bands: Width expansion indicates rising volatility, often leading to significant price moves, whereas contraction (the “squeeze”) signals consolidation and a potential breakout. Advanced traders monitor band touches, breakouts, and use the squeeze as a precursor to volatility expansion—validated with volume spikes and candlestick signals to anticipate breakouts or breakdowns with higher confidence.
- Fibonacci Retracement and Extension: These levels dynamically adapt to recent swings, acting as key support/resistance zones during corrections. Combining Fibonacci levels with trendlines, volume profiles, and oscillators enhances reliability. Fibonacci time zones or spirals can be employed to anticipate the timing of reversals or breakouts, adding a temporal dimension that complements price-based analysis, offering a more holistic view of potential market turning points.
Chart Patterns and Their Predictive Power
Identifying chart patterns grants traders the ability to forecast future price movements with increased confidence—especially when patterns align with volume and indicator confirmations. Here are some advanced insights into pattern recognition and their trading implications:
- Head and Shoulders & Inverse Head and Shoulders: Renowned for their strong reversal signals, these patterns gain reliability when confirmed with volume spikes during the breakout or breakdown (neckline). Traders often wait for the pattern to complete and volume confirmation before executing trades, minimizing false signals. The measured move projection, derived from the pattern height, assists in setting profit targets.
- Double Top and Double Bottom: These are classic reversal patterns. Validation includes a decisive break and retest of the neckline on high volume, coupled with divergence signals in oscillators like RSI or MACD—indicating momentum exhaustion and preparing traders for trend reversals.
- Triangles (Symmetrical, Ascending, Descending): These consolidation patterns often precede significant breakouts. Advanced traders analyze the pattern’s size, volume patterns, and the prior trend to estimate breakout direction and potential price targets using measured move techniques. Breakouts from ascending triangles tend to be bullish, while descending triangles are typically bearish, but confirmation with volume is essential to avoid false breakouts.
- Flags, Pennants, and Wedges: Short-term continuation patterns that frequently appear after sharp moves. Volume usually increases during the formation and the subsequent breakout. The length of the pattern and the pole/flag size help project the magnitude of the next move, enabling precise target setting and risk management.
The Crucial Role of Volume in Chart Analysis
Volume analysis is paramount for validating technical signals. A breakout accompanied by high volume indicates strong conviction, reducing the likelihood of false signals and increasing the probability of trend continuation. Binance’s real-time order book data, along with advanced volume metrics such as VWAP (Volume Weighted Average Price), cumulative volume, and OBV (On-Balance Volume), enable traders to gauge market strength. Divergences between price action and volume—such as declining volume during a rally—may signal exhaustion, while increasing volume on a breakout confirms its validity. Incorporating volume analysis into your core strategy enhances accuracy and provides early warnings for potential fakeouts or traps.
Integrating Multiple Tools for Robust Analysis
Relying on a single indicator or pattern can be risky; hence, a multi-faceted approach mitigates false signals. Advanced traders synthesize multiple tools—combining RSI divergence, Fibonacci levels, trendlines, volume confirmation, and oscillators—to validate trade setups. For example, a bullish divergence in MACD, a breakout above a key Fibonacci resistance, and high volume collectively form a powerful buy signal. Employing hierarchical analysis across multiple timeframes—such as confirming a daily trend with 4-hour and 1-hour charts—reduces noise and enhances decision confidence. This layered confirmation system is vital for maintaining consistency amid the unpredictable nature of crypto markets.
Developing a Disciplined Trading Strategy
Successful Binance trading hinges on meticulous planning and unwavering discipline. Define your specific entry and exit criteria rooted in technical signals: pattern formations, indicator confirmations, volume cues, and risk parameters. Implement robust risk management tools like stop-loss and take-profit orders to protect capital, adjusting them dynamically based on market volatility and pattern targets. For instance, after confirming a bullish engulfing pattern at a support zone, place a stop just below the recent swing low and set profit targets at key Fibonacci resistance levels. Regularly review your trades, analyze outcomes, and refine your strategy accordingly—this feedback loop fosters continuous improvement. Maintaining a detailed trading journal is crucial for tracking decision rationale, emotional responses, and outcomes, which helps identify biases and optimizes future performance.
Market Sentiment and External Factors
While technical analysis provides powerful insights, integrating macroeconomic data, news events, and sentiment analysis enhances your edge. Cryptocurrency markets are highly sensitive to regulatory announcements, macroeconomic shifts, and social media sentiment. Sudden news can override technical signals, causing rapid and unpredictable moves. Monitoring platforms like Twitter, Reddit, and Telegram for market sentiment, alongside official news outlets, helps anticipate volatility spikes or reversals. Sentiment analysis tools—such as Fear & Greed indices or social media sentiment trackers—offer quantitative measures of market mood, allowing traders to position themselves advantageously and avoid being caught off-guard by news-driven moves.
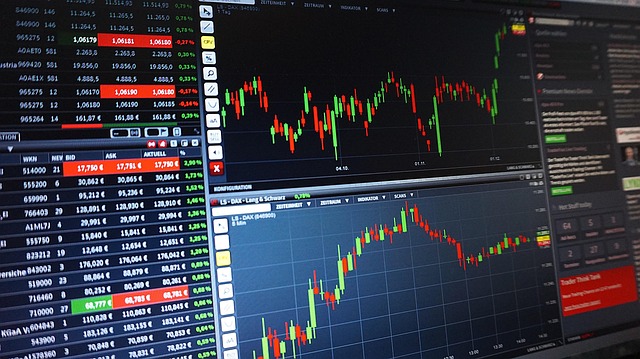
Choosing the Right Platforms and Tools
For optimal analysis, leverage advanced charting platforms that combine real-time data with powerful tools. Binance’s native trading interface offers extensive indicator options, drawing tools, and customization, but complementing it with third-party platforms like TradingView, Coinigy, or CryptoCompare enhances analytical depth. These platforms provide multi-exchange data, scripting capabilities for custom indicators, and social features for community insights. Automated alert systems and trading bots can notify you of key signals, ensuring swift execution. Engage with trading communities and follow expert analyses to refine your approach. Regular backtesting of your strategies on historical data helps improve accuracy, build confidence, and adapt your tactics to evolving market conditions.
Conclusion: Mastering Binance Chart Analysis for Sustainable Trading
Achieving mastery in Binance trading chart analysis is an ongoing, disciplined journey. It requires deep comprehension of technical indicators, pattern recognition, volume dynamics, external influences, and strategic execution. Patience and continuous learning, coupled with systematic backtesting and rigorous risk management, underpin long-term success. Combining multiple analytical tools—such as trendlines, Fibonacci levels, volume confirmations, and sentiment signals—creates a resilient decision-making framework that minimizes false signals and optimizes entry and exit timing. Maintaining a detailed trading journal, staying informed on market developments, and adapting your strategies based on feedback and evolving data are key to sustained growth. As your expertise deepens, chart analysis transforms from a simple skill into a comprehensive system for consistent profitability in the dynamic and competitive cryptocurrency markets.